4.1 Development Status of Organic Livestock and Poultry in China
4.1.1 Overview of the Development of the Organic Livestock and Poultry Farming Industry
In 2014, the main types of organic livestock in China included beef cattle, dairy cattle, dual-purpose cattle for milk and meat, sheep, goats, pigs, horses, donkeys, and other animals, among multiple breeds. In 2014, the number of certificates issued for organic livestock and poultry animals was 427, of which 382 were organic certificates (89.46%) and 45 were conversion certificates (10.54%). As shown in Figure 4-1, organic chicken had the most certification certificates, at 112, followed by pigs (101), sheep (99), cattle (83), and other animals (32).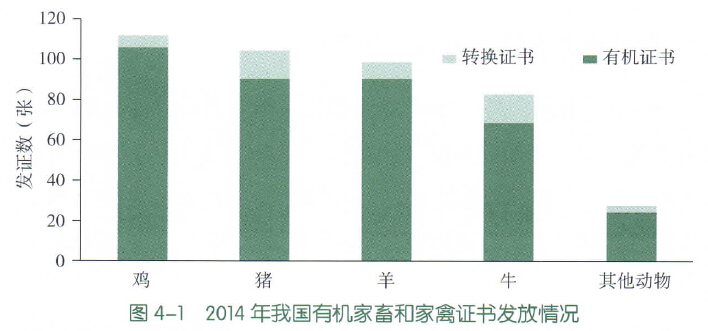 文章源自FOFCC-http://fofcc.org.cn/am/11576/
In 2014, the total output of livestock, poultry, and their products produced in accordance with national standards was 1.056 million tons. Sheep, cattle, and pigs were the main farmed livestock, among which there were 4.14 million organic sheep, nearly 1.15 million organic cattle, and nearly 163,000 organic pigs. In terms of output, the total output of organic livestock was
263,000 tons, of which the output of organic sheep was 130,000 tons, the output of organic cattle reached 113,000 tons, organic pigs were 14,000 tons, and there was also production of horses, donkeys, deer, and other animals, but their proportion was relatively small
(Figure 4-2).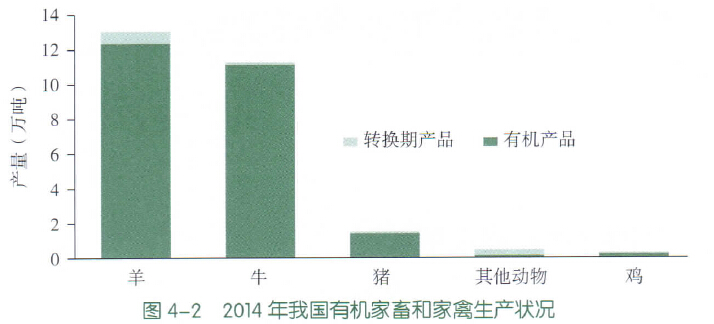 文章源自FOFCC-http://fofcc.org.cn/am/11576/
In poultry farming production, in 2014 China raised a total of 1.428 million organic chickens (including broilers and laying hens), occupying a dominant position in organic poultry production; in addition, organic duck production ranked second, with a total of nearly 60,000 birds, and organic geese were 40,000 birds.
Among animal products, the total production in 2014 was 793,000 tons, of which organic cow milk was the main animal product, at 784,000 tons, accounting for 99.0% of the total output of organic animal products; the output of organic eggs was 4,000 tons, accounting for 0.5% of the total output of organic animal products.
4.1.2 Regional Distribution of the Organic Livestock and Poultry Farming Industry
In China, apart from Taiwan and Macao, all other 32 provinces, municipalities, and autonomous regions have organic livestock and poultry production. The top five regions in terms of the number of organic pigs raised were Heilongjiang, Anhui, Sichuan, Jilin, and Shandong. The total number raised in these five provinces accounted for 70.9% of all organic pigs. These provinces and municipalities are also major grain-producing provinces, providing abundant sources of organic feed. In addition, 17 other provinces, municipalities, and autonomous regions also had organic pig farming.
A total of 18 provinces, municipalities, and autonomous regions had organic beef cattle farming. The top five in terms of number raised were Xinjiang, Qinghai, Sichuan, Inner Mongolia, and Beijing. Beef cattle farming in these five provinces, municipalities, and autonomous regions accounted for 92.3% of the total beef cattle farming volume. Xinjiang and Qinghai had an absolute advantage in the number of organic sheep raised, while Inner Mongolia, Tibet, and Gansu ranked third to fifth. The number of organic sheep raised in these five provinces, municipalities, and autonomous regions also accounted for
99.2% of the total number of organic sheep. From the above analysis, it can be seen that the farming areas for organic livestock were mainly distributed in northwestern China, with grazing as the main mode. For organic poultry farming, the number of organic chickens was the largest. A total of 26 provinces, municipalities, and autonomous regions across the country had organic chicken farming, among which Beijing, Guangdong, Xinjiang, Sichuan, and Inner Mongolia ranked in the top five, and the sum of their farming numbers accounted for 76.2% of the total farming volume (Figure 4-3).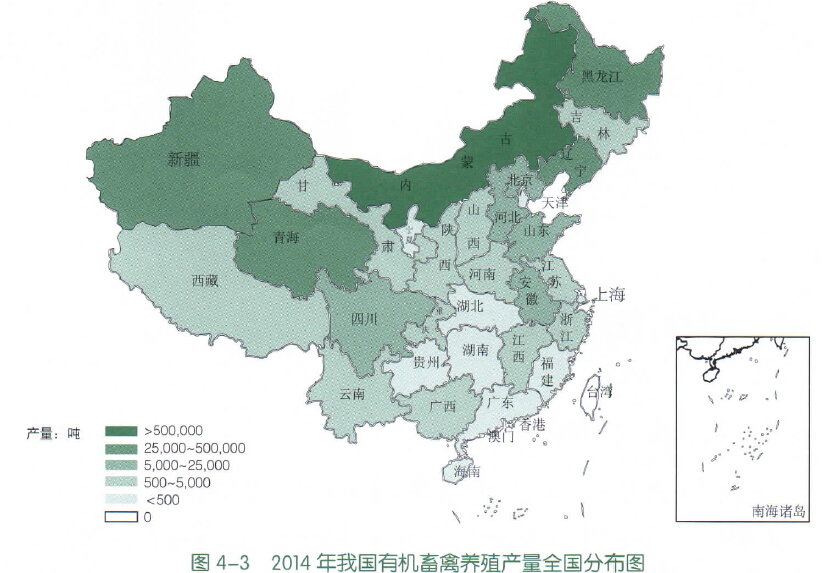 文章源自FOFCC-http://fofcc.org.cn/am/11576/
4.1.3 Development Trends of Organic Livestock and Poultry Farming
Figure 4-4 shows the production status of China's main organic livestock and poultry from 2009 to 2014. The number of organic pigs was smaller than that of organic cattle, organic chickens, and organic sheep. The number of organic pigs was relatively stable, basically maintained within the range of 150,000 to 220,000 head. The number of organic cattle showed an obvious upward trend, but declined somewhat in 2014. Organic chicken farming was basically maintained within the range of 1.1 million to 1.5 million birds. The number of organic sheep was the largest, but the farming number was not stable and fluctuated over the six years.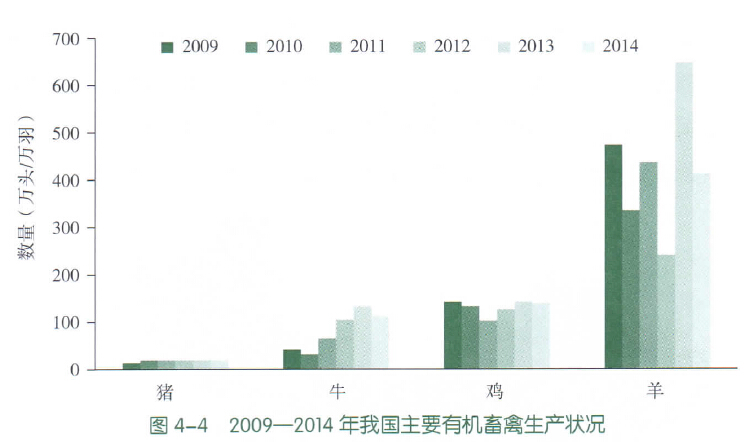 文章源自FOFCC-http://fofcc.org.cn/am/11576/
4.2 Development Status of Organic Aquaculture in China
4.2.1 Overview of Organic Aquaculture Development
According to the Catalogue of Organic Product Certification, aquatic products are divided into four categories: aquatic plant products, fresh and live fish, crustaceans and invertebrates, and aquatic vertebrates. In 2014, the number of certificates issued for organic aquatic products was 340, including 301 organic certificates (88.53%) and 39 conversion certificates (11.47%). Fresh and live fish had the most certification certificates, at 169, followed by crustaceans and invertebrates (104), aquatic vertebrates (42), and aquatic plants (25) (Figure 4-5).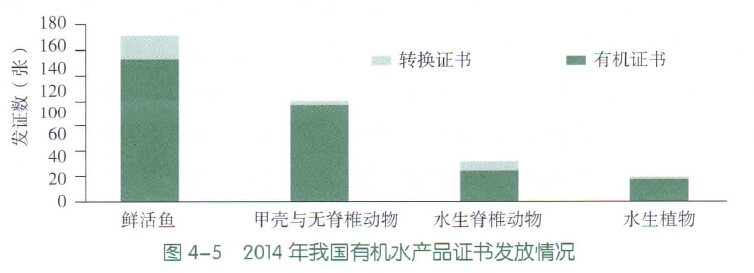 文章源自FOFCC-http://fofcc.org.cn/am/11576/
In 2014, the total output of aquatic products was 29.4 tons, of which aquatic plant products (mainly kelp and laver produced in seawater) accounted for 187,000 tons, making up 63.7% of the total certified aquatic product output; next were fresh and live fish (freshwater fish and marine fish) at 71,000 tons, accounting for 24.0%, of which 97.4% of the products were freshwater fish. Crustacean and invertebrate products totaled 36,000 tons, accounting for 12.2%. The output of aquatic vertebrate products (turtles) was 561 tons, accounting for a very small proportion, only 0.2%. From the perspective of the proportion of conversion-period products and organic products, the proportion of conversion period in the three categories of aquatic plant products, fresh and live fish, and crustaceans and invertebrates was less than 1%; however, for aquatic vertebrate production (turtles), in addition to low output, 45.5% of the products were conversion products (Figure 4-6).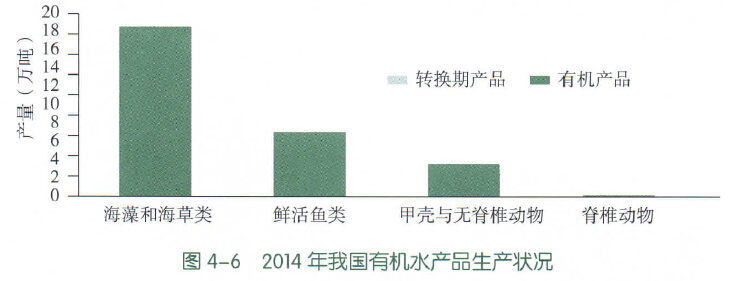 文章源自FOFCC-http://fofcc.org.cn/am/11576/
Figure 4-7 shows China's top ten certified organic aquatic products by number of certificates in 2014. Among the ten aquatic products, there were six types of fresh and live fish, three types of crustaceans and invertebrates, and one type of aquatic vertebrate (turtle). Bighead carp, silver carp, and grass carp are all common freshwater fish in China. In 2014, the numbers of certification certificates were 97, 76, and 56, respectively, and the numbers of certified enterprises were 95, 75, and 55, respectively. For turtles, mitten crabs, sea cucumbers, and others, the certification certificates ranged from 13 to 39, and the number of certified enterprises ranged from 13 to 38.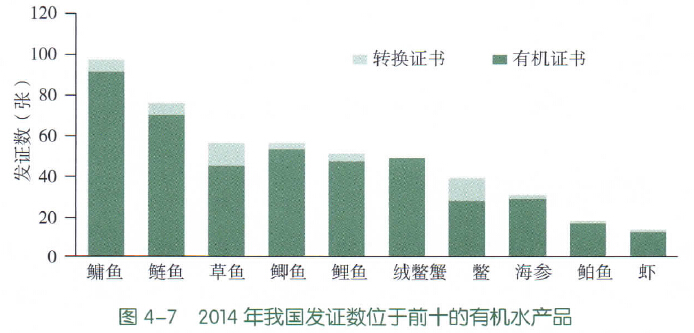 文章源自FOFCC-http://fofcc.org.cn/am/11576/
4.2.2 Regional Distribution of Organic Aquaculture
From the perspective of production regions for organic aquatic products, Shandong had the largest production, reaching nearly 173,000 tons, of which the output of aquatic plant products, namely kelp, was 159,000 tons. Next were Hubei, Liaoning, Fujian, and Jiangsu, ranking second to fifth, respectively. Among them, Hubei's organic aquatic products were mainly freshwater fish, Liaoning's aquatic products were mainly sea cucumbers and shellfish, while Fujian and Jiangsu had seaweed-based aquatic plant products. Organic fish had the widest production range, with production in 24 provinces and municipalities, while aquatic plant products were produced only in 7 coastal provinces and municipalities, including Shandong, Fujian, Zhejiang, and Liaoning (Figure 4-8).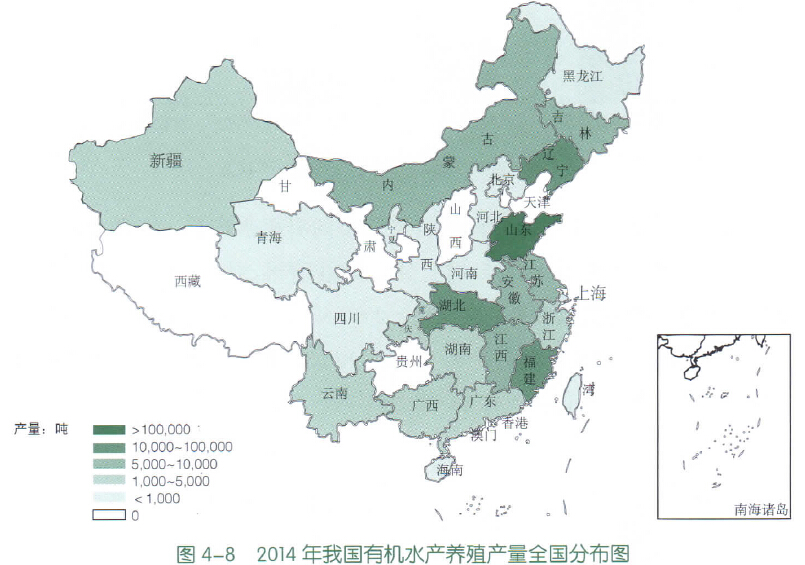 文章源自FOFCC-http://fofcc.org.cn/am/11576/
4.2.3 Development Trends of Organic Aquaculture
Figure 4-9 shows the trend of changes in China's organic aquatic product production from 2009 to 2014. From the perspective of total output, the production of aquatic products still showed a year-by-year growth trend, increasing from 17 tons in 2009 to 32 tons in 2011, and then basically remaining at around 300,000 tons for the following three years. Among them, the production of aquatic plant products increased year by year, remaining above 160,000 tons from 2012 to 2014, making it the product with the highest output in aquatic product production. The production of fresh and live fish was mainly freshwater fish, and changes from 2009 to 2013 were relatively stable, basically maintained at around 100,000 tons, before declining to 71,000 tons in 2014. The production of crustaceans and invertebrates fluctuated relatively greatly, showing upward trends in 2009-2011 and 2012-2013. For aquatic vertebrate products, mainly referring to the production of soft-shelled turtles or turtles, the output of such products had always been very low. There was no production in 2009, only 4,000 to 5,000 tons in 2010 and 2011, 10,000 tons in 2013, and only 561 tons in 2014.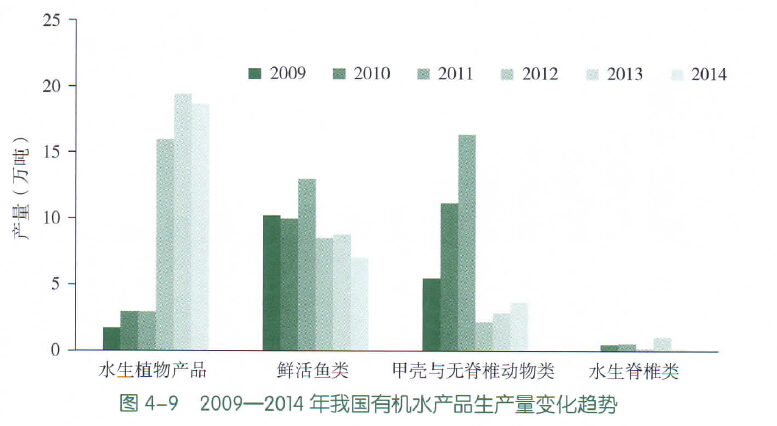 文章源自FOFCC-http://fofcc.org.cn/am/11576/
4.3 Certification Status of Organic Processed Products
4.3.1 Overview of the Development of Organic Processed Products
In the Catalogue of Organic Products, processed organic products are divided into 20 categories according to the classification of national economic industries: meat products and by-product processing, aquatic product processing, processed or preserved vegetables, fruit juice and vegetable juice, processed and preserved fruits and nuts, vegetable oil processing, by-products of vegetable oil processing, treated liquid milk or cream, other dairy products, grain milling, starch and starch products, processed feed, baked foods, noodle and other grain flour products, foods not elsewhere classified, baijiu, wine and fruit wine and other fermented wines, beer, other natural fibers for spinning, and clothing. In 2014, except for beer, all other 19 categories of processed products had production and certification.
In 2014, the number of organic certificates issued for organic processed products was 3,602, including 3,146 organic certificates and 456 conversion certificates; the number of certified enterprises was 3,477. Grain milling had the largest number of certificates issued, at 1,570, with 1,516 certified enterprises; next was foods not elsewhere classified with 834 certificates issued and 805 certified enterprises. Processed products with more than 100 certificates issued also included vegetable oil processing, processed and preserved fruits and nuts, processed or preserved vegetables, meat products and by-product processing, and wine and fruit wine and other fermented wines (Figure 4-10).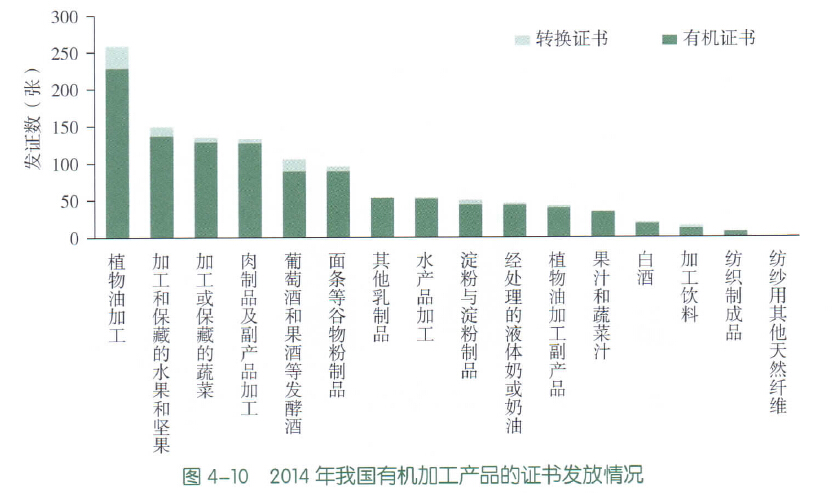 文章源自FOFCC-http://fofcc.org.cn/am/11576/
In 2014, the total output of organic processed products was 2.284 million tons. Among processed products, grain milling had the highest output, reaching 953,000 tons, accounting for 41.7% of the total output of organic processed products, mainly rice (flour) and wheat flour; treated liquid milk or cream ranked second, at 451,000 tons, accounting for 19.8%; processed feed ranked third, at 244,000 tons, accounting for 10.7%. The above three categories of products accounted for 72.2% of processed product output (Figure 4-11). Among these processed products, conversion-period products in grain milling products accounted for 4.8%, while the proportions of conversion-period products in treated liquid milk or cream and processed feed were both less than 1.2%.
The output of by-products of vegetable oil processing, noodle and other grain flour products, baijiu, vegetable oil processing, and processed or preserved vegetables was 50,000 to 100,000 tons, accounting for 2.2% to 4.1%; the output of fruit juice and vegetable juice, starch and starch products, meat products and by-product processing, etc. was less than 50,000 tons, accounting for less than 2.0%.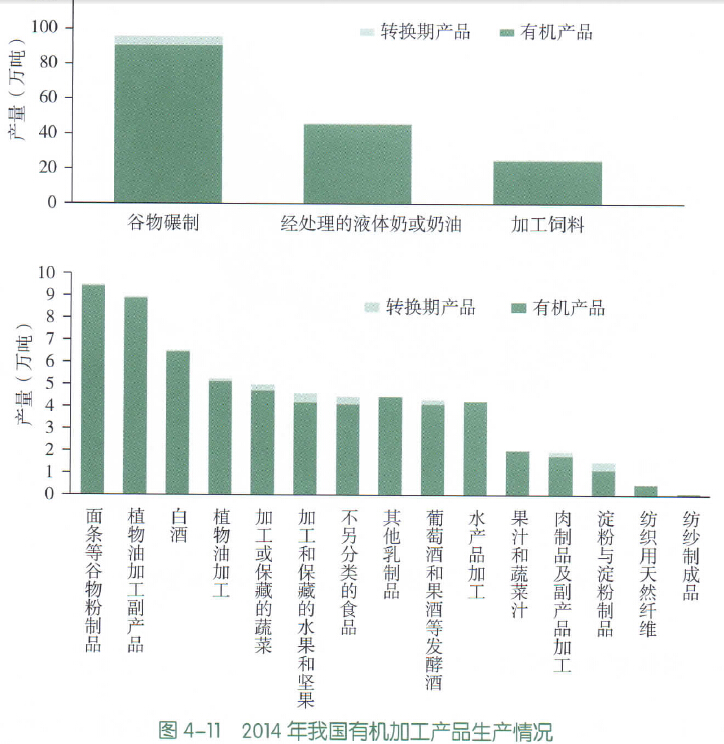 文章源自FOFCC-http://fofcc.org.cn/am/11576/
4.3.2 Regional Distribution of Organic Processed Products
In 2014, except for Macao, all 33 provinces, municipalities, and autonomous regions had organic processed product production. Organic processed products were mainly distributed in Northeast and North China, and western provinces such as Guizhou and Xinjiang also had relatively high output (Figure 4-12). From the overall distribution, the distribution areas of processed products matched those of crop production.
The top five provinces, municipalities, and autonomous regions in terms of organic processed product output were Inner Mongolia, Heilongjiang, Guizhou, Liaoning, and Hebei. The sum of their output was 1.734 million tons, accounting for 75.9% of the total output. Inner Mongolia had the highest output, at 779,000 tons, of which treated liquid milk and cream were 415,000 tons and processed feed was 215,000 tons. Heilongjiang ranked second, with an output of 324,000 tons, mainly based on the processing of rice flour, corn flour, and vegetable oil, of which rice flour output was 170,000 tons. Guizhou's output was 291,000 tons, mainly based on wheat flour, convenience foods, and baijiu processing.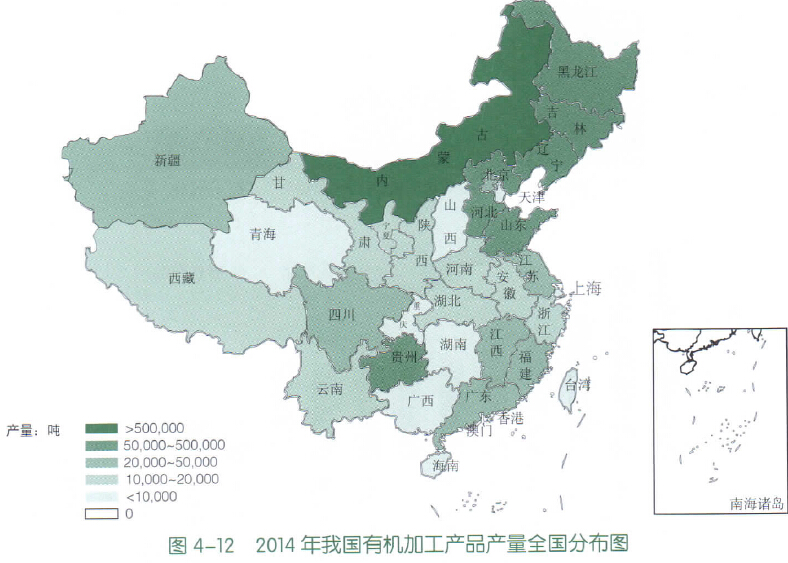 文章源自FOFCC-http://fofcc.org.cn/am/11576/
4.3.3 Development Trends of Organic Processed Products
Figure 4-13 shows the trend of changes in China's organic processed product output from 2009 to 2014. From the perspective of output, the output of organic processed products was basically within the range of 2 million to 5 million tons. Compared with 2013, the output of organic processed products in 2014 decreased by 580,000 tons, a decline of 20.3%, mainly caused by a decrease in the output of fruit juice and vegetable juice. In 2013, the output of fruit juice and vegetable juice was 790,000 tons, while in 2014 it was 20,000 tons (in 2013, organic aloe juice was about 750,000 tons, and there was no certification in 2014); the output of by-products of vegetable oil processing decreased by 75,000 tons. Compared with 2013, the output of processed feed, grain milling, and treated liquid milk or cream increased in 2014, by 149,000 tons, 98,000 tons, and 66,000 tons, respectively. From 2009 to 2014, the proportion of conversion-period products remained within the range of 3.0% to 7.5%.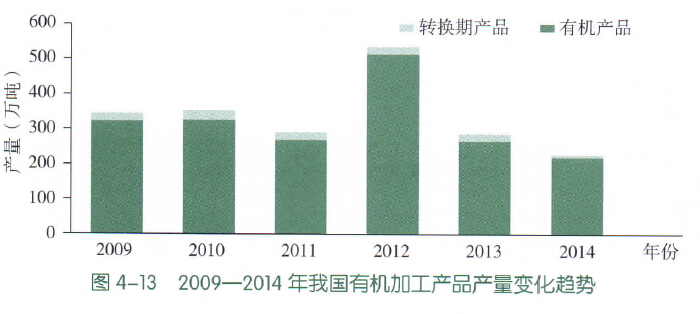 文章源自FOFCC-http://fofcc.org.cn/am/11576/