6.1 Estimates of domestic organic product output value and trade
6.1.1 Domestic organic product output value
The data related to the output value of organic products used for analysis in this section also originates from the China Food and Agricultural Product Certification Information System. Certified enterprises report the production volume and output value of their certified organic products (estimated on the assumption that all organic products are sold) to the organic certification bodies, which in turn report them collectively to the information system.
Organic products in China are primarily divided into four major categories: plant-based, livestock and poultry, aquaculture, and processed products. Data on output value is estimated by enterprises based on their own production and reported to the Food and Agricultural Products Information System; according to statistics, the total output value of all types of organic products in 2014 amounted to 116.4 billion yuan.The output value of processed products stood at 75 billion yuan, of which processed liquid milk and cream accounted for as much as 28 billion yuan; processed products accounted for 64.4% of the total output value of organic products. The output value of cereals was 8.5 billion yuan, accounting for 7.3%;followed by fruit and nuts at 7.6 billion yuan, accounting for 6.5%. The output value of these three product categories accounted for 78.3% of the total output value (Table 6-1).
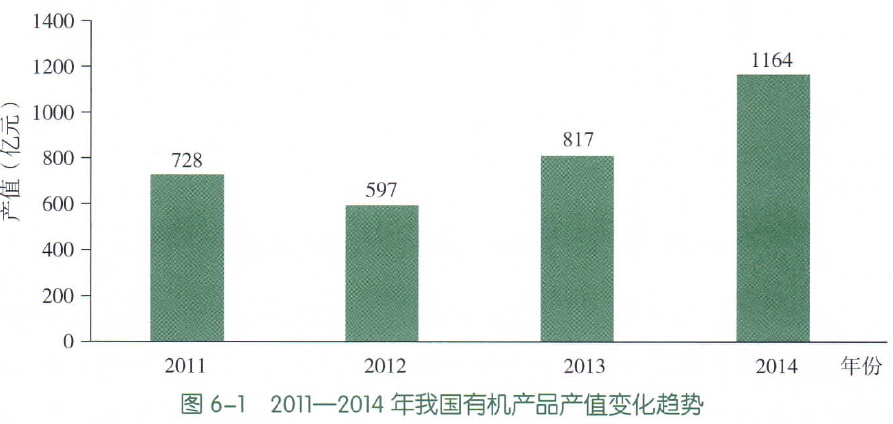
Figure 6-1 shows the total output value of organic products for four consecutive years from 2011 to 2014, which were 72.8 billion yuan, 59.7 billion yuan, 81.6 billion yuan and 116.4 billion yuan respectively. As can be seen from the figure, in recent years, with the increase in the production area and product varieties of organic products, the output value of organic products has also been continuously increasing. Except for a decrease in the output value of organic products in 2012, the output values in 2013 and 2014 both increased continuously, with 2014 seeing an increase of over 40% compared to 2013.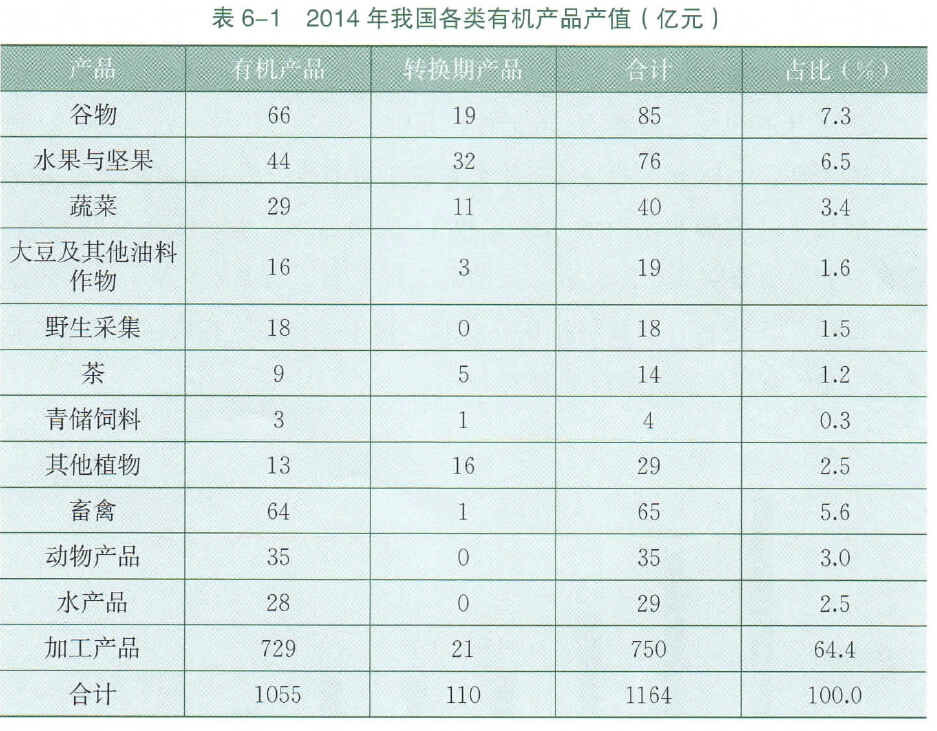 文章源自FOFCC-http://fofcc.org.cn/en/11574/
6.1.2 Registration status of the China organic product label
In 2012, China established a 17-digit organic code management system known as “one code per product”, requiring the organic code to be used on the smallest sales packaging of certified products. When applying for the organic label and organic code, enterprises must specify the names and production volumes of the products they intend to sell, and report them through certification bodies to the China Food and Agricultural Product Certification Information System. The data on the output value of organic products used for analysis in this section are also sourced from this information system.
In 2014, 1.056 billion organic labels were filed, of which 727 million were for milk, accounting for 68.90%. Figure 6-2 shows the top ten products by the number of organic label filings in 2014 (excluding milk). Baijiu accounted for 36 million (including 27 million for Kweichow Moutai), yoghurt for 28 million, rice for 20 million, vegetables and wine for 13 million each, sterilized milk for 12 million, broken-wall Ganoderma lucidum spore powder for 9 million, milk powder for 8 million, and grain products for 7 million. The sum of the organic label filings for these ten categories of products accounted for 82.8% of the total organic label filings.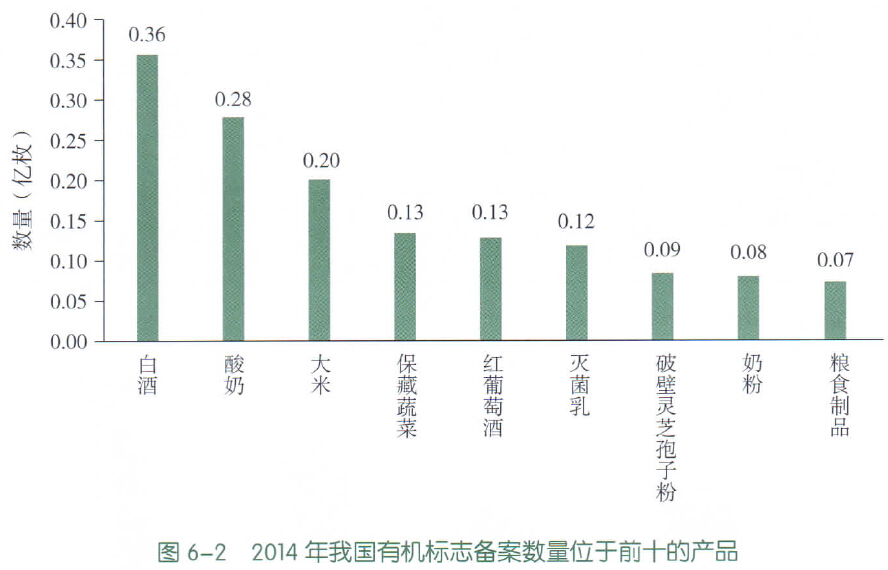 文章源自FOFCC-http://fofcc.org.cn/en/11574/
Among the 22 certified organic bodies, the top five in terms of the number of organic product label registrations are Zhonglv Huaxia, Wuzhou Hentong, and Liaoning Fangyuan (Figure 6-3). Zhonglv Huaxia accounts for 51.22% of the total organic label registrations, Nanjing Guohuan accounts for 29.45%, Hangzhou Wantai accounts for 7.11%, while Wuzhou Hentong and Liaoning Fangyuan account for 1.92% and 1.84% respectively. The sum of the proportions of organic label registrations held by these five certification bodies is as high as 91.54%.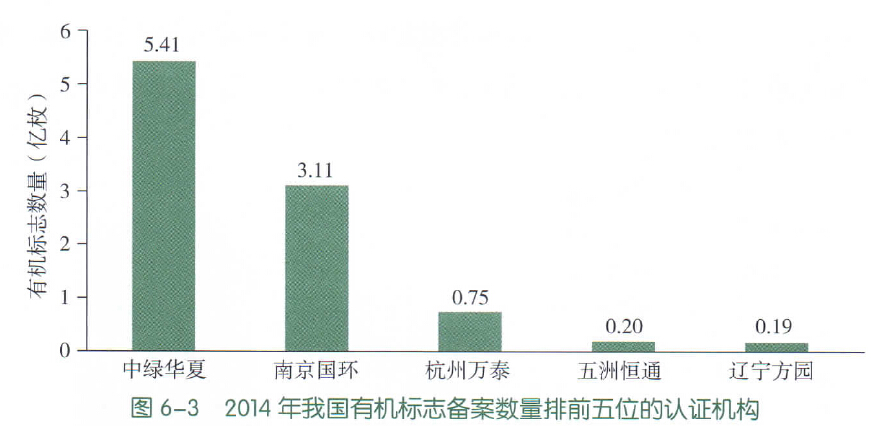 文章源自FOFCC-http://fofcc.org.cn/en/11574/
By region, excluding Taiwan, Macao and Hong Kong, the remaining 31 provinces, municipalities and autonomous regions all have organic label filings. Inner Mongolia has the highest number at 455 million, followed by Guizhou with 35 million, Heilongjiang with 30 million, Shandong with 26 million, and Guangdong with 17 million. There are another 6 provinces and municipalities, including Zhejiang and Shanghai, with quantities exceeding 10 million; there are 13 provinces, municipalities and autonomous regions, such as Xinjiang, Jiangxi, Jiangsu and Sichuan, with quantities ranging from 1 million to 10 million; 7 provinces, municipalities and autonomous regions, including Henan, Chongqing and Tianjin, each have fewer than 1 million organic label filings (Figure 6-4).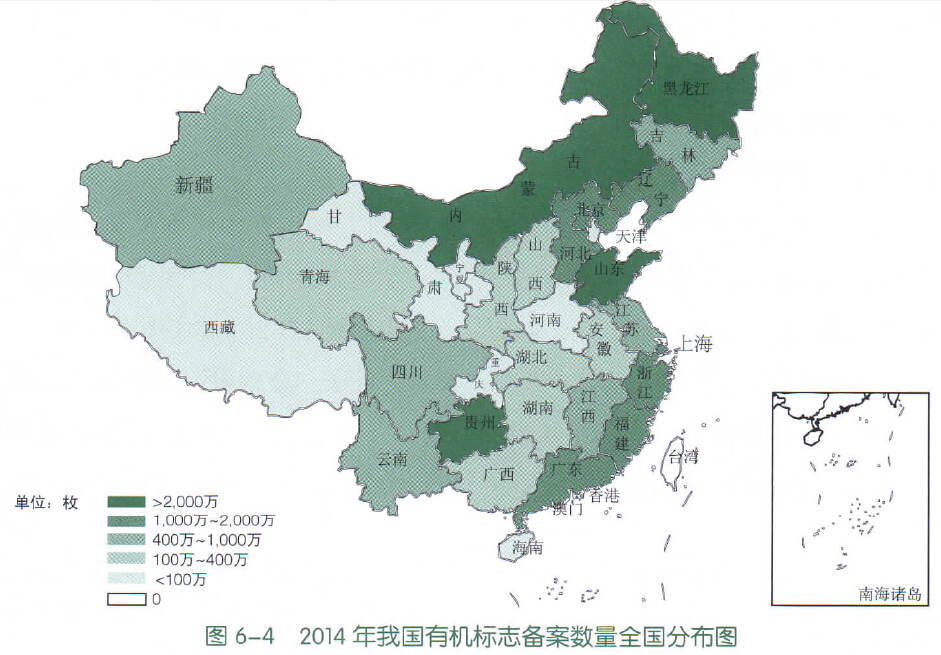 文章源自FOFCC-http://fofcc.org.cn/en/11574/
Between 2012 and 2014, the number of registered organic product labels showed a marked upward trend, increasing in each quarter (Figure 6-5). In 2013, the figure increased by 39.41 TP3T compared with 2012, and in 2014, it increased by 47.91 TP3T compared with 2013.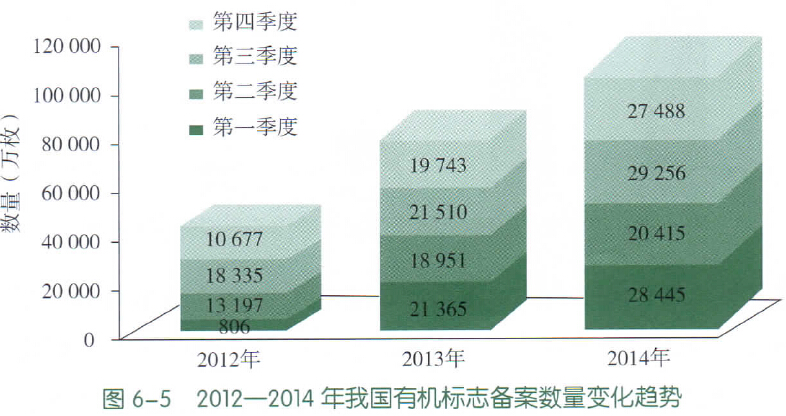 文章源自FOFCC-http://fofcc.org.cn/en/11574/
6.1.3 Domestic certified sales volume of organic products (enterprises must specify the product names and weights they intend to sell when applying for the organic product label; the certified sales volume discussed in this section refers to the weight reported by enterprises when applying for the organic label, which can represent their sales volume, though not entirely identical, as some products may not be sold in the current year)
In 2014, the total certified volume of organic product labels issued was 432,000 tonnes, of which processed products accounted for 3.54 million tonnes, representing 81.9%; followed by plant products at 73,000 tonnes, representing 16.8%; aquatic products at 4,000 tonnes, and livestock and poultry at 1,000 tonnes. Livestock and poultry products only included poultry eggs, while livestock and poultry meat and meat products were counted under processed products, with chilled livestock and poultry meat at 2,000 tonnes.
6.1.3.1 Plant-based products
In 2014, the verified volume of issued labels for plant-based products was 73,000 tonnes, of which cereals accounted for 38,000 tonnes or 52.2%; followed by fruit at 20,000 tonnes, accounting for 26.9%; vegetables at 12,000 tonnes; and soybeans, oilseeds, nuts and other plants had lower verified volumes of issued labels, with other plants accounting for only 264 tonnes (Figure 6-6).
The verified volume of grain distribution markers was 38,000 tonnes, with sales across eight categories of grain products including rice, millet, and miscellaneous grains. Wheat had the highest verified volume of distribution markers at 27,000 tonnes, accounting for 70.1%, followed by maize at 5,000 tonnes (11.9%), millet at 4,000 tonnes (10.1%), and miscellaneous grains at 2,000 tonnes. The verified volumes of distribution markers for paddy rice, sorghum, oats, and barley were all less than 200 tonnes, with barley having a verified volume of distribution markers of only 13 tonnes.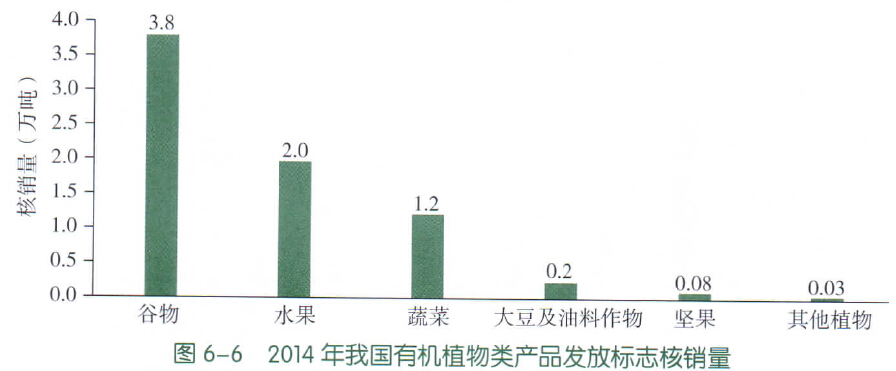 文章源自FOFCC-http://fofcc.org.cn/en/11574/
There is a wide variety of vegetables; in this section, they are categorised into three types: root and tuber vegetables, leafy vegetables and fruiting vegetables. The total volume of vegetables covered by distribution permits was 12,000 metric tonnes, with leafy vegetables accounting for the highest volume at 7,000 metric tonnes (56.6%);followed by cucurbits at 4,000 metric tonnes (31.11 TP3T), whilst root and tuber vegetables accounted for the smallest share at 1,000 metric tonnes (12.31 TP3T).文章源自FOFCC-http://fofcc.org.cn/en/11574/
In 2014, the verified volume of organic fruit label distribution was 20,000 tonnes, including fruits such as pomelos, apples, melons, pears, and jujubes. Pomelos had the highest verified volume of label distribution at 10,000 tonnes, accounting for 50.0%, followed by apples at 3,000 tonnes, accounting for 14.1%. The verified volume of label distribution for melons, other fruits, sweet oranges, pears, and jujubes was over 1,000 tonnes each. The verified volume of organic nut label distribution was 807 tonnes, with nuts mainly consisting of walnuts, chestnuts, and other nuts. Walnuts had a verified volume of label distribution of 492 tonnes, accounting for over half of the total nut verified volume.
The verified volume of issued labels for soybeans and oilseed crops is a mere 0.2 thousand tonnes. For other plants, such as plant-based traditional Chinese medicines and aromatic plants, the verified volume of issued labels is only 264 tonnes.
6.1.3.2 Livestock, poultry and aquatic products
The verification volume for the distribution of poultry eggs in 2014 was 1,401 tonnes, of which 1,398 tonnes were hen eggs, and duck eggs and stork eggs accounted for 4 tonnes and 0.1 tonnes respectively.
In 2014, the certified sales volume of organic aquatic products was 0.44 ten thousand tonnes, of which fish accounted for 0.2 ten thousand tonnes, representing 48.61 per cent, followed by aquatic plant products at 0.2 ten thousand tonnes, accounting for 38.39 per cent.Certified sales volumes for crustaceans, invertebrates and soft-shelled turtles were relatively low, at 297 tonnes and 40 tonnes respectively.
6.1.3.3 Processed products
In 2014, the volume of labels issued for certified organic processed products was 354,000 tonnes, of which processed liquids
Milk or cream came in first at 191,000 tonnes, accounting for 54.1%, followed by milled grain products at 61,000 tonnes, accounting for 17.2%, processed feed and alcoholic beverages at 30,000 tonnes each, and other dairy products at 12,000 tonnes. The sum of the verified volumes for processed products with a verified volume exceeding 10,000 tonnes accounted for 91.3% of the total verified volume for all processed products. Vegetable oil processing, as well as processed or preserved vegetables, each had verified volumes of under 10,000 tonnes. Figure 6-7.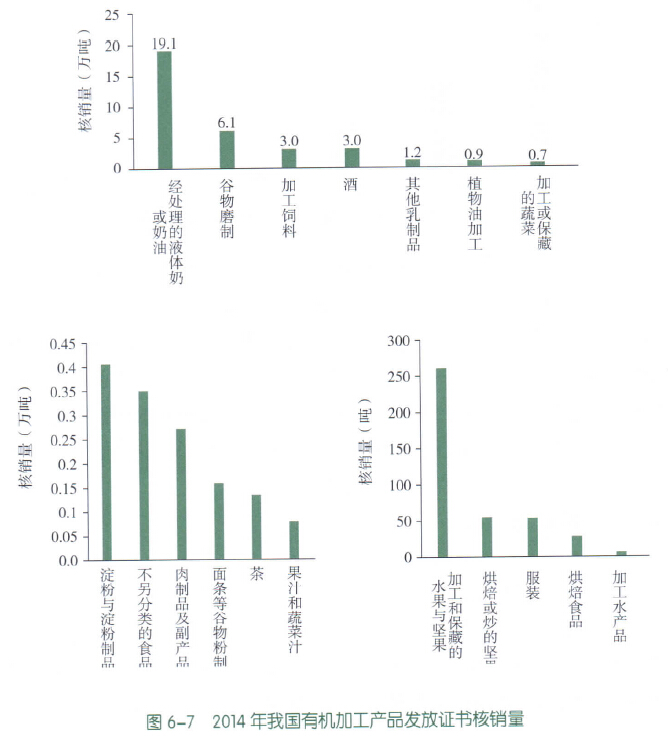 文章源自FOFCC-http://fofcc.org.cn/en/11574/
6.1.4 Estimation of domestic sales of organic products
Organic product sales are estimated based on the volume of label verification sales and the current price of organic products (organic product prices are estimated based on conventional product prices: depending on the category, organic product prices range from 2 to 4 times the price of conventional products). In 2014, organic product sales reached 30.2 billion yuan, of which processed organic products accounted for 28.37 billion yuan, representing 93.7% of total sales; followed by plant-based products at 1.62 billion yuan, accounting for 5.4%; aquatic products and livestock and poultry had sales of 0.24 billion yuan and 0.04 billion yuan respectively. For livestock and poultry, only the sales of poultry eggs are counted, while livestock and poultry meat are included in processed products.
In 2014, sales of organic plant products amounted to 1.61 billion yuan, of which fruit sales reached 0.59 billion yuan, accounting for 36.4%; followed by cereals at 0.39 billion yuan, vegetables at 0.31 billion yuan, and nuts at 0.23 billion yuan. Other plants, soybeans and other oilseed crops had lower sales, with the sum of the two being 0.09 billion yuan. The volume of nut subsidies and certified sales was much smaller than that of vegetables, but their sales figures were similar, mainly because the prices of nuts such as walnuts and pine nuts were much higher than those of vegetables (Figure 6-8).
In 2014, the sales of organic aquatic products reached 240 million yuan, of which fish (freshwater and marine fish) sales amounted to 120 million yuan, accounting for 48.5%; followed by crustaceans and invertebrates at 60 million yuan, accounting for 24.8%; plant-based aquatic products at 50 million yuan, and aquatic vertebrates (soft-shelled turtles) had the lowest sales, at only 10 million yuan. Although the issued logo verification volume for crustaceans and invertebrates was much lower than that of plant-based aquatic products, due to their higher prices, their sales exceeded those of plant-based aquatic products. In 2014, the sales of livestock and poultry products were 36.47 million yuan, of which egg sales were 36.34 million yuan.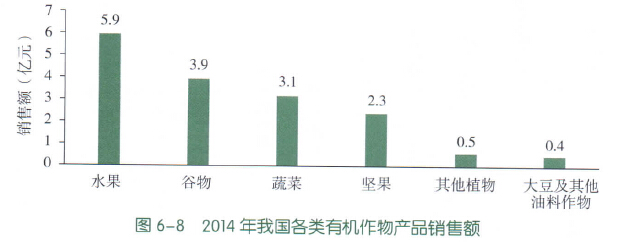 文章源自FOFCC-http://fofcc.org.cn/en/11574/
In 2014, the sales revenue of organically processed products was 28.37 billion yuan, among which wine sales were 11.83 billion yuan, accounting for 41.7%; followed by processed liquid milk or cream at 5.74 billion yuan, accounting for 20.2%. Although the approved standard volume for the distribution of processed liquid milk or cream reached as high as 191,000 tonnes, the price was much lower than that of wine, so the sales revenue was lower than that of wine. Other products with sales revenue above 1 billion yuan include other dairy products (4.80 billion yuan), tea (2.02 billion yuan), and milled grain products (1.21 billion yuan). The total sales revenue of these products accounted for 90.2% of the total sales revenue of organically processed products. The sales revenue of vegetable oil, unclassified foods, processed or preserved vegetables, meat products and by-product processing, and starch and starch products ranged from 100 million to 1 billion yuan; the sales of processed products such as cereal flour products like noodles, fruit juice, and vegetable juice were all below 100 million yuan (Figure 6-9).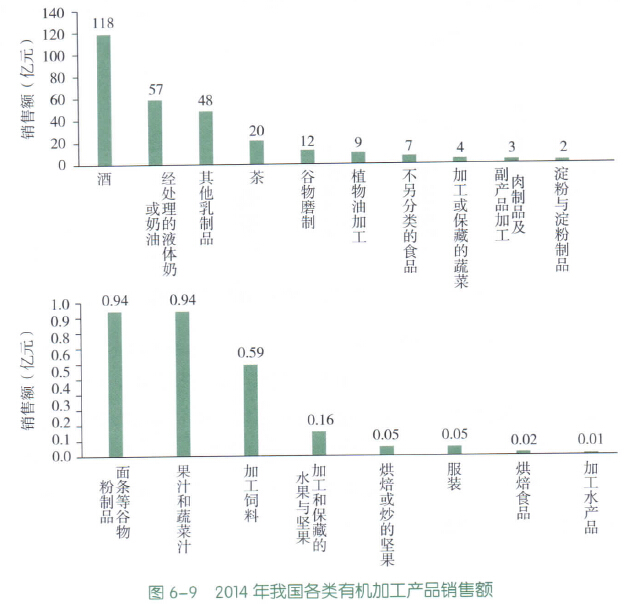 文章源自FOFCC-http://fofcc.org.cn/en/11574/
6.2 China's organic products export trade
6.2.1 Overview of China's organic products export trade
In 2014, China's total export trade value of organic products was 586 million USD, with a total trade volume of 284,700 tonnes. In terms of trade value, processed products had the highest trade value at 403 million USD, accounting for 68.83% of the total trade value; followed by primary agricultural products at 173 million USD (29.48%), wild harvested products at 7.7147 million USD (1.32%), and animal products at 2.1914 million USD (0.37%) (Table 6-2).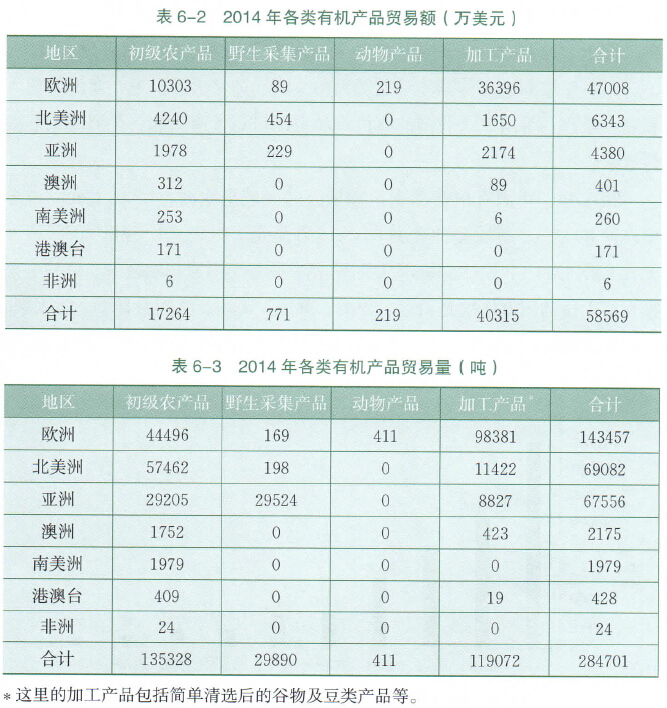 文章源自FOFCC-http://fofcc.org.cn/en/11574/
In terms of trade volume, primary agricultural products ranked first at 135.33 thousand tonnes, accounting for 47.58% of the total trade volume, followed by processed products at 119.1 thousand tonnes (41.76%), wild harvested products at 29.9 thousand tonnes (10.51%), and animal products at 0.4 thousand tonnes (0.14%). Although the trade volume of processed products was lower than that of primary agricultural products, their trade value was significantly higher. The trade value of organic processed products accounted for more than half of the export trade value of organic products, and their trade volume was also close to half (Table 6-3).
6.2.2 Regional distribution of organic product export trade
In the 2014 organic product export trade, China's organic products were exported to more than 30 countries and regions in total. These countries are mainly distributed in Europe, such as the UK, Germany, the Netherlands, Italy, France, Sweden, Switzerland, Belgium, Spain, Austria and Denmark; followed by Asian countries such as Japan, South Korea, Singapore and Thailand; North American countries like the US and Canada; and Oceanian countries such as Australia and New Zealand. China's organic products were also exported to South America, Africa, and the regions of Hong Kong, Macao and Taiwan.
In 2014, the region with the highest export value of organic products from China was Europe, with 470 million USD, accounting for 80.29% of the total export value. This was followed by North America with 63.4316 million USD (10.83%) and Asia with 43.6046 million USD (7.45%). China's organic products were exported to more than 30 countries and regions, and the top ten countries by trade volume in order were the Netherlands, Germany, the United Kingdom, the United States, France, Japan, Italy, Denmark, Austria, and Canada. The total trade volume of these ten countries was 500 million USD, accounting for 85.55% of China's total export trade volume in 2014 (Figure 6-10).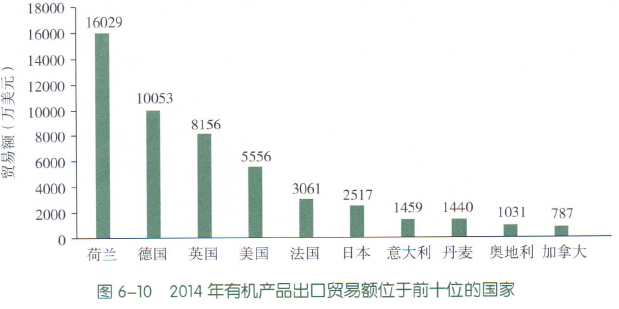 文章源自FOFCC-http://fofcc.org.cn/en/11574/
Europe also ranked first in terms of trade volume, at 143,500 metric tonnes (50.451 TP3T), followed by North America with 69,100 metric tonnes (24.291 TP3T) and Asia with 67,200 metric tonnes (23.641 TP3T);whilst the combined trade volume of South America, Australia, Africa and the Hong Kong, Macao and Taiwan regions totalled just 0.46 metric tonnes. In terms of trade volume, the top ten countries were Japan, the United States, the Netherlands, Germany, the United Kingdom, Denmark,Canada, Italy, Switzerland and Spain; the total trade volume of these ten countries and regions amounted to 256,800 tonnes, accounting for 90.00% of the total export trade volume.Japan ranked first in terms of trade volume but sixth in terms of trade value; this is because 86.34% of the trade volume consisted of primary agricultural products and wild-harvested products (Figure 6-11).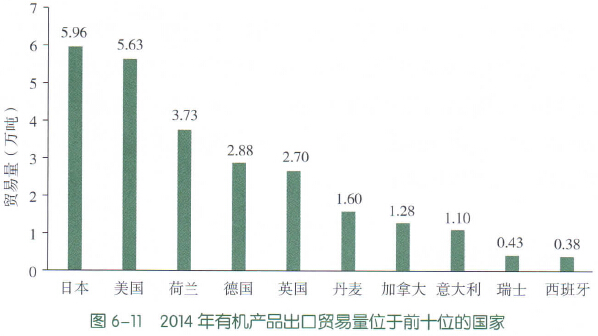 文章源自FOFCC-http://fofcc.org.cn/en/11574/