8.1 Comparative analysis with the global development status of organic products
The Research Institute of Organic Agriculture (FiBL) in Switzerland and the International Federation of Organic Agriculture Movements (IFOAM) surveyed and compiled statistics on organic agriculture data across 170 countries worldwide (compared with 164 countries in 2012) (FiBL & IFOAM, 2015). By the end of 2013, the total area of agricultural land managed organically worldwide (including land in conversion) reached 43.1 million hectares. The top three countries were Australia (17.2 million hectares), Argentina (3.2 million hectares), and the United States (2.2 million hectares). China's organic farming area stood at 2.188 million hectares, ranking fourth, just behind the United States.
A comparative analysis of China's main organic product production areas in 2013 and the global organic product production areas in 2013 (Table 8-1) shows that the planting areas of organic cereals, vegetables, pulses, and oilseeds in China account for about 1/5 of the global total, while the production of organic tea accounts for over 70%, demonstrating China's significant share in these main organic crops. However, foreign countries have large-scale production of organic crops such as silage, cocoa, and coffee, whereas China's production area is relatively small or lacks such crops. Therefore, overall, the planting area of organic crops produced in accordance with China's organic product standards accounts for only 3.0% of the global total.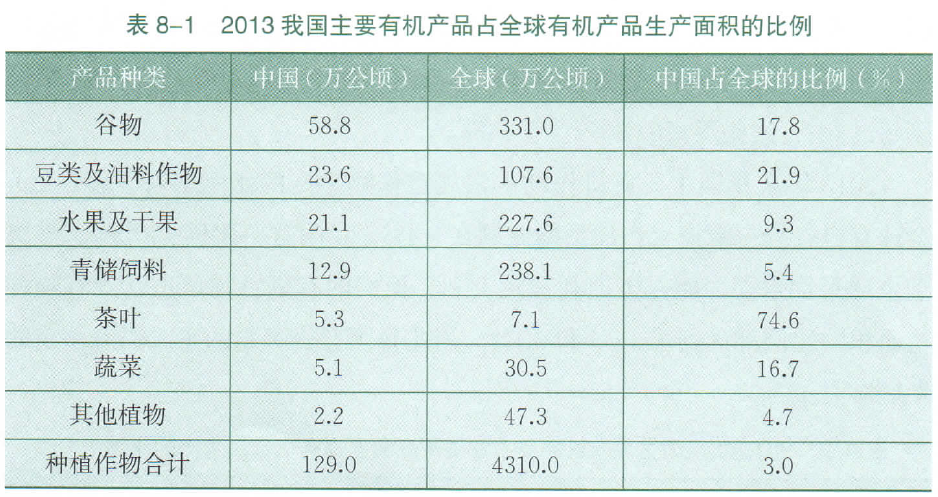
In terms of wild harvesting production, it has remained at around 1 million hectares in recent years. Compared with the global wild harvesting area, China's wild harvesting area accounts for about 5%. Of course, China has vast land, and wild harvesting production still has great development potential according to the demands of the organic market.
8.2 Analysis of China's domestic organic product production potential
Compared to conventional agricultural production, organic agricultural production is not simply a matter of eliminating synthetic pesticides and fertilisers. It is a production system that combines flexibility and stringent management, beginning with soil management practices such as sound nutrient cycling, productivity and tillage, incorporating integrated and preventative pest and disease management methods, and culminating in organic certification to become an organic product. The proportion of organic products relative to conventional production demonstrates the development potential of organic products in China, which we will analyse separately in terms of organic products and different provinces.
8.2.1 Development potential of different organic products
Looking at the share of organic farming area in global agricultural land, the proportion of organic products compared to conventional production averages 1.0% (FiBL & IFOAM, 2015). In 2013, China's proportion was 0.95%, which is slightly below the global average. Asia's average is 0.2%, with Oceania the highest at reaching 2.9%. Among countries with available data, China's organic agriculture cultivation area ranking globally is 63rd. There are 10 countries where the proportion of organic production area exceeds 10%, and another 17 countries exceed 5%, with 80% of these countries located in Europe.
Judging by the proportion of major organic crops in conventional crop production in China in 2013 (Table 8-2), the global average proportion of organic cereals in conventional production was 0.4%, while in China this proportion was 0.5%, slightly higher than the global average. Meanwhile, in Austria and Italy, the proportions of organic cereals in conventional cereal cultivation area reached 12% and 6.1% respectively. Therefore, there is still some potential for development in the production of organic cereals in China.
When it comes to vegetable production, the proportion of organic vegetables in China stands at 0.2%, while the global average is also low at just 0.4%. In contrast, the share of organic vegetable cultivation area compared to conventional vegetables is 21.8% in Denmark, reaches 16.5% in Austria, and exceeds 10% in Germany. China is a major vegetable producer, accounting for about half of the world's vegetable growing area and output. Although transitioning vegetable production to organic methods presents certain challenges, increasing technological investment means that China still holds immense potential for organic vegetable production, particularly in suburban areas where demand is growing and there is significant market space.
The proportion of land area dedicated to organic fruit and dried fruit production is relatively higher compared to other organic products; the global average share of organic fruit stands at 3.7%, whilst in China it is 1.2%.In France, Spain and Italy—which have the largest areas under organic grape production—the proportion of organic production ranges from 8.01 TP6T to 8.51 TP6T.In countries with significant areas under organic apple and pear cultivation, such as the United States and Poland, the proportion of organic production can account for between 3% and 6% of conventional production. As these fruits are also major fruit varieties in China, increasing investment in technology in this area would unlock considerable potential for the development of organic fruit production in the country.
The cultivation area of organic legumes and oilseeds in our country accounts for 1.5% of the conventional production area, which is significantly higher than the global level of 0.4%. In contrast, this proportion in Denmark and Austria can reach between 40% and 58%, indicating that there is still substantial room for improvement in the production of organic legumes and oilseeds in our country.
Organic tea is an advantageous product among China's organic products. The proportion of organic tea to conventionally produced tea is 2.9%, which is significantly higher than that of other crops. Most of China's tea-producing regions are located in mountainous areas, where both geographical location and climatic conditions are favourable for the organic production of tea, leaving plenty of room for further development.
8.2.2 Development potential of the organic industry in different provinces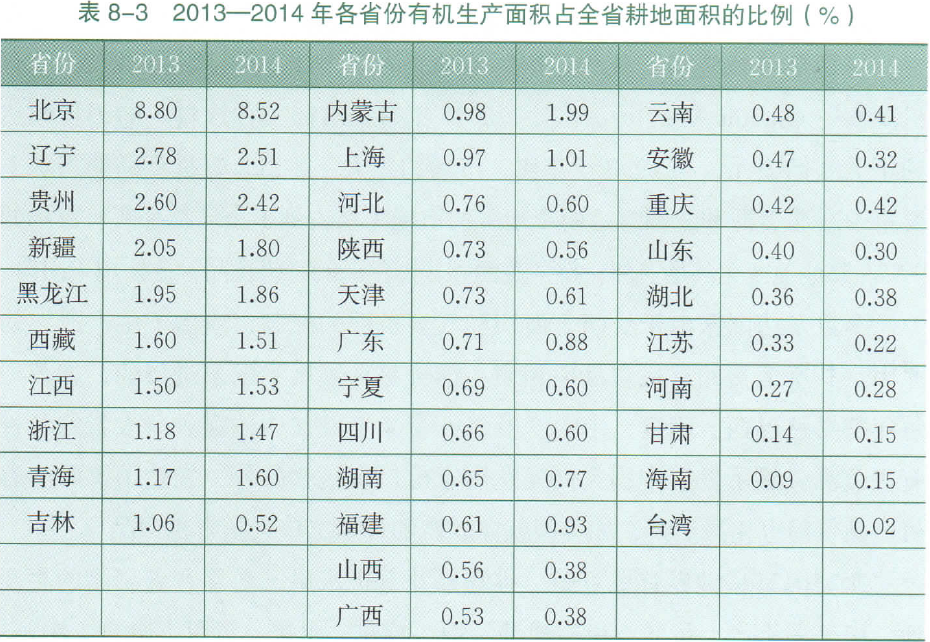
It can be seen from the above analysis that the organic production areas vary across provinces, which is closely related to local climatic conditions and the development of agricultural production. From the proportion of organic production area in each province's arable land area in China in 2014 (Table 8-3), it can be seen that although Beijing has a relatively small organic farming area of just over 20,000 hectares, the proportion of the city's arable land area it occupies reached 8.52%, ranking first in the country in both 2013 and 2014, and placing 12th globally.
In 2014, the provinces with the largest organic production areas—Liaoning, Guizhou, Inner Mongolia, Xinjiang and Heilongjiang—also had high proportions of organic production areas, approaching or exceeding 2%. Although provinces and municipalities such as Tibet, Jiangxi, Zhejiang and Qinghai did not have particularly high absolute areas of organic production, they ranked near the top in terms of the proportion of organic production area to the province's total arable land area, especially Tibet and Qinghai.
There were 11 provinces where the proportion of organically farmed area to total arable land exceeded 1% in 2014, 9 provinces where this proportion ranged between 0.5% and 1%, and 11 provinces with less than 0.5%. Organic production area in China accounted for 0.83% of the country's total agricultural arable land (based on domestic production areas adhering to Chinese standards), with 13 provinces having an organic land proportion that exceeded the national average.
8.3 Development Potential of Organic Product Exports in China
Despite the slowdown in global economic growth, international sales of organic products continue to grow. OrganicMonitor estimates that sales of organic food, including beverages, reached 72 billion US dollars in 2013, which is about a fourfold increase in the market compared to 1999. The demand for organic products is mainly concentrated in North America and Europe, with these two regions accounting for 90% of the global organic market. Organic food produced in other regions, especially Asia, Latin America and Africa, is mainly used for export.
Due to limitations in land area and climatic conditions, or for reasons of production costs, a considerable proportion of the organic food consumed in many developed countries is imported from developing countries. For instance, the UK imports large quantities of various organic foods every year from nine developing countries, including Brazil, India, China and Mexico. In addition to developing countries exporting organic food to developed countries, trade in organic products between developed countries is also quite active; for example, the US exports large quantities of organic products to the EU and Japan.
North American countries are major producers of organic pulses, grains, and organic fruit, vegetables, and dairy products. South America produces large quantities of organic olive oil, sugar, cotton, fruit, cocoa, and coffee. Asian countries, led by China, Thailand, Sri Lanka, and Malaysia, mainly produce organic tea, vegetables, rice, pulses, seeds, coffee, spices, and oilseeds. Australia and Argentina are the main suppliers of organic beef. In Africa, many non-governmental organisations are helping local communities develop organic agriculture; for example, organic cotton, fruit, vegetables, and spices from Egypt are already exported in large quantities to Europe, Madagascar supplies organic spices and tropical vegetable oils to the world organic market, and Tanzania exports organic tea, cotton, spices, and tropical fruits to Europe (CNCA, 2014). In 2014, China's total export trade value of organic products was 585 million US dollars, with a total trade volume of 284,400 tonnes. Looking at China's export of organic products over the years, pulse products and oilseed crops had the highest export volumes, remaining at around 100,000 tonnes annually, accounting for 43.8%~62.7% of the total trade volume, with a trade value of about 70 million US dollars. These were followed by bulk agricultural products such as processed vegetable oil by-products, processed and preserved vegetables, and grains, each with an export volume of over 10,000 tonnes. Processed feed, milled grain products, processed and preserved fruits and nuts, vegetables, vegetable oils, fruit and vegetable juices, plant-based herbal medicines, and processed feed had export volumes ranging only between 1,000 and 9,000 tonnes, while animal products, textiles, aquatic products, and starch products had smaller export volumes, all under 1,000 tonnes.
Based on the above analysis, the current proportion of organic products compared to conventional products in our country is relatively low, leaving considerable room for development in both the domestic and export markets. Despite various challenges ahead, the future outlook for the global organic food industry is encouraging, and the domestic market is still set to experience a period of positive growth.
8.4 Issues in the data collection and analysis process
8.4.1 Organic product certification data
The data for organic product certification in China comes from the “China Food and Agricultural Product Certification Information System” (hereinafter referred to as the Information System) developed by cnca. As the information collection and release platform for food and agricultural product certification under the national certification accreditation administrative authority, this Information System serves as an important source of information for the analysis of China's organic industry development. During the data analysis process, the following main issues were identified, which need to be continuously improved and perfected in future reporting processes.
8.4.1.1 Cultivated and wild-collected products shall be clearly distinguished.
Wild-harvested and cultivated products must be clearly distinguished during system data entry to avoid data confusion during subsequent statistical analysis. This is particularly important for products that exist as both cultivated and wild-harvested, such as edible fungi, perennial vegetables, grapes, nuts, and botanical traditional Chinese medicines. Such data should be subject to uniform standard measures when issuing certificates and reporting into the system.
8.4.1.2 Production matches area
How the cultivation area for artificially grown edible fungi is determined should be standardised across all certification bodies. Currently, some bodies fill in the number of fungus logs, whereas others fill in the area. The yield per unit area for plant products should
Caps should be set based on the yield per unit area of conventional products, and yield limits are equally required for livestock, poultry and aquaculture. Data on the area and yield of plant products must be provided; if there is no yield for the current year, an explanation must be given. Data on the quantity and yield of livestock and poultry products must be provided; if there is no yield for the current year, an explanation must be given. Meanwhile, consistency in units must be ensured when reporting data, and the units provided by the system should be used to avoid massive discrepancies.
8.4.1.3 The product name entered should strictly follow the classification in the Organic Products Directory.
When entering or extracting data for statistical analysis, you should strictly follow the classification in the Organic Products Catalogue to avoid confusing product names with product scopes.
8.4.1.4 Acquisition of sales data
Currently, there is no direct channel to obtain sales data for organic products. In the 2014 data analysis, we analysed in detail the number of organic label filings and the verified output of organic products. Sales figures can be entered at the same time as verifying the organic product output, which allows for a more accurate confirmation of sales information.
8.4.2 Special supervisory inspection of organic products
8.4.2.1 Inadequate sample size for certain organic product categories
In the distribution sector, the Beijing and Shanghai markets have a relatively high demand for organic products, which are sold in most supermarket chains and high-end residential communities. However, due to higher prices and short shelf lives, retailers' stock levels fail to meet the sampling base requirements. Organic fruit in particular, owing to its seasonal characteristics, can vary significantly in the types and batches sampled at different times, making it difficult to collect the required quantities of specified varieties within a short period. In the production sector, organic products are highly seasonal; some provinces and municipalities failed to complete sampling tasks in accordance with the plan requirements for reasons such as products having already been sold out leaving no samples, or products not yet having reached maturity and therefore being unable to be sampled.
The scope of production enterprises and certification bodies covered by 8.4.2.2 is limited.
For individual products such as dairy and alcoholic beverages, there are relatively few organic production enterprises, and annual random inspections consistently point to the same few enterprises and products, lacking horizontal comparability across multiple samples. At the same time, the representativeness of samples inspected in the circulation sector needs to be improved, as there are instances where multiple samples are taken from a single enterprise. It is recommended that for enterprises with a larger market presence, sampling can be arranged concurrently in the production sector to further uncover issues.
8.4.2.3 Inexperienced network sampling
In 2014, random inspections of organic products sold on online platforms were piloted for the first time, with a total of 13 batches inspected. During the online sampling process, due to information asymmetry, sampling personnel stated that it was difficult to ensure that the sampled products were from the same production date, presenting a certain degree of purchasing risk.
8.4.2.4 The Quality Supervision Bureau experiences difficulties in undertaking sampling work
During the random inspection process, some quality supervision bureaus stated that they had difficulties undertaking the sampling work: first, some bureaus reported that they had limited staff responsible for sampling and that the personnel lacked experience in sampling work, suggesting that centralized training be provided for the relevant staff of the quality supervision bureaus; second, testing institutions communicate directly with enterprises after completing tests, and local quality inspection departments are not getting timely information on substandard products that appear. It is suggested that testing institutions should simultaneously provide a copy of the testing report to the sampling unit for record-keeping, to facilitate local bureaus in carrying out subsequent processing of enterprises with substandard products in a timely manner.文章源自FOFCC-http://fofcc.org.cn/en/11571/
Analysis of the development potential of China's organic industry
Read more...