3.1 General overview of organic crop production
As of December 31, 2014, the overall production situation according to China's organic product standards was as follows: the total area for organic plant production was 1.946 million hectares, of which organic cultivation area accounted for 1.124 million hectares, and the total production area for wild collection was 0.822 million hectares. The total output of organic plant products was 7.516 million tonnes, of which organically certified output was 6.903 million tonnes, and the total output from wild collection was 0.613 million tonnes.
As can be seen from Figure 3-1, the production areas classified by different crops, in descending order of size, are cereals, pulses and other oilseeds, fruit and nuts, silage, tea, other plants and vegetables. In terms of organic production output, organic cereals, silage, and fruit and nut crops rank in the top three. The production details for each category of crop will be discussed in depth in this section.
In terms of production area, the proportions of oilseed crops and conversion-period forage products were relatively low, at 12% and 13% respectively. Excluding forage and oilseed crops, the conversion-period products of the main cultivated crops all accounted for between 22% and 42%, while conversion-period crop yields accounted for 27% to 38%. Overall, conversion-period production area accounted for 22.6% of the total organic cultivation area, and conversion-period product yield accounted for 27.5% of the total organic product yield.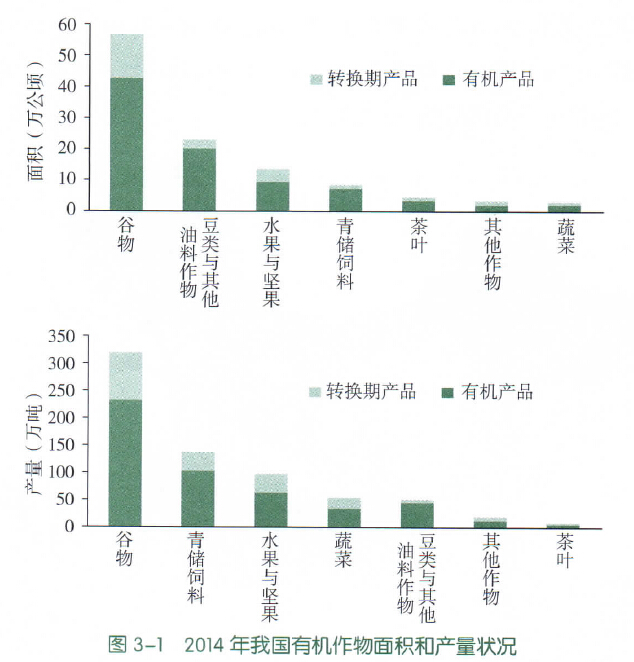 文章源自FOFCC-http://fofcc.org.cn/en/11577/
3.2 Regional distribution of organic crop production
Statistical results show that in 2014, 33 provinces, municipalities and autonomous regions in China, excluding Macao, carried out the production and certification of organic products. Figure 3-2 is a national distribution map of organic crop cultivation areas in China in 2014. As can be seen from the figure, the provinces in China with an organic crop production area of over 100,000 hectares are Heilongjiang, Inner Mongolia, Guizhou and Liaoning, among which Heilongjiang's organic production area reached 220,000 hectares, accounting for 19.6% of the total national organic production area, and the combined area of the four provinces accounted for 51.1% of the total national organic production area. Xinjiang's cultivation area was 74,000 hectares, ranking fifth. It can also be seen from this set of data that northeast China and the Xinjiang region are the main production areas for organic cultivation in China.
In addition, 6 provinces and municipalities, including Hebei, Jiangxi, and Sichuan, also have organic production areas ranging from 25,000 to 50,000 hectares, while another 12 provinces, municipalities, and autonomous regions, such as Yunnan and Guangdong, have organic production areas between 10,000 and 25,000 hectares. This means there are 18 provinces, municipalities, and autonomous regions with organic production areas between 10,000 and 50,000 hectares, which are basically located in the central and eastern regions of China. Meanwhile, western regions such as Chongqing, Qinghai, and Gansu, as well as provinces like Hainan and Taiwan, all have organic production areas of less than 10,000 hectares.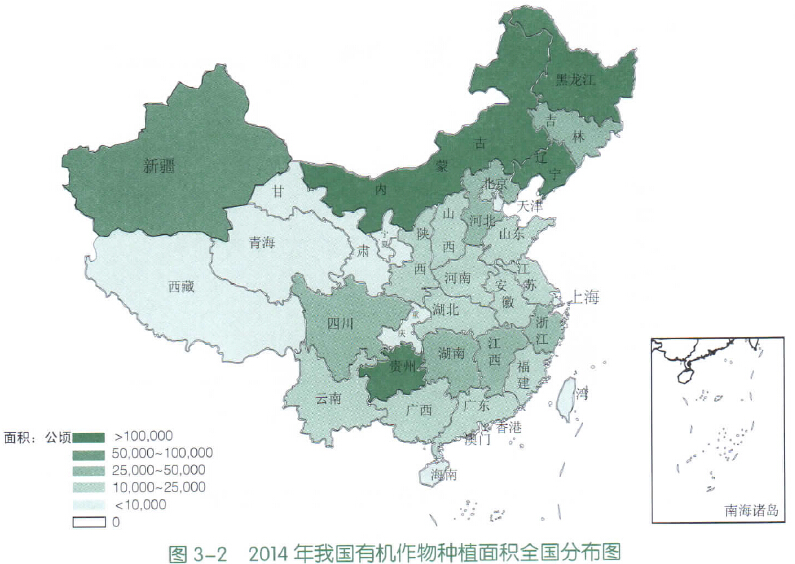 文章源自FOFCC-http://fofcc.org.cn/en/11577/
3.3 Trends in organic crop production development
In 2005, China promulgated the national standard for "Organic Products", marking the entry of China's organic industry into a period of standardised development. In terms of organic production area, the total area of organic cultivation within China increased year by year from 464,000 hectares in 2005 to 940,000 hectares in 2009, representing the largest growth rate, which was more than double that of 2005. From 2009 onwards, the growth rate of organic production area was small, while the area of conversion land showed an upward trend. The total area of organic production has increased year on year, basically maintaining around 1 million to 1.2 million hectares over the past 5 years (Figure 3-3). In 2014, the total area of organic crop cultivation was 1.124 million hectares, a decrease of 170,000 hectares compared with the production area in 2013. In terms of yield, the output of organic products was about 2.78 million tonnes in 2005, growing to 4.13 million tonnes by 2009. Overall, the yield of organic crops in China has shown an upward trend, reaching approximately 7 million tonnes in both 2013 and 2014.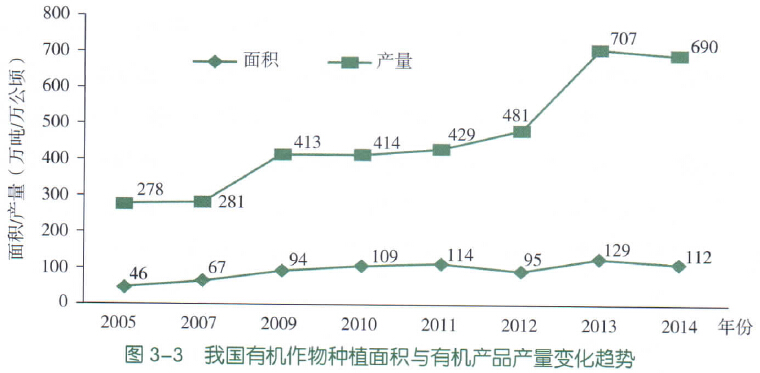 文章源自FOFCC-http://fofcc.org.cn/en/11577/
3.4 Production status of different crops
According to the Organic Product Directory published in Announcement No. 2, 2012 of cnca, organic plant products are further divided into ten categories: cereals, vegetables, fruits and nuts, pulses and other oil crops, flowers, spice crop products, sugar crops, other plants (including wild collection), seeds and propagation materials, and plant-based traditional Chinese medicines. Based on organic production conditions, among the six categories of flowers, spice crop products, sugar crops, other plants, seeds and propagation materials, and plant-based traditional Chinese medicines, except for wild collection and tea, the production scale of other products is very small. Therefore, this paper groups the production conditions of these six categories into other plant products for analysis, and analyses cereals, vegetables, fruits and nuts, pulses and other oil crops, tea, and wild collection separately.
3.4.1 Cereal production
3.4.1.1 Overview of Grain Production
In 2014, whether ranked by the number of certificates issued, area, or yield, the top four were rice, wheat, maize, and sorghum. The yield of minor cereal grains was relatively low, with only buckwheat ranking in the top ten by yield.
A total of 3,887 certificates were issued for organic grains, comprising 2,783 organic certificates and 1,104 conversion certificates. In 2014, the top ten organic grain products by number of certificates issued were rice, maize, sorghum, wheat, millet, mung beans, adzuki beans, black beans, kidney beans and buckwheat. Among these ten crops, the latter five belong to coarse grains. Organic rice received the highest number of certificates at 1,358, accounting for 34.94% of total organic grain certificates, with 1,252 certified enterprises; this was followed by maize with 733 certificates (18.86%), sorghum with 547 certificates (14.07%) and wheat with 462 certificates (11.89%). The number of certificates issued for coarse grains and millet were 353 and 320 respectively, representing proportions of 9.08% and 8.23%; oats and barley had fewer certificates at 84 and 30 respectively, with proportions of 2.16% and 0.77% (Fig. 3-4).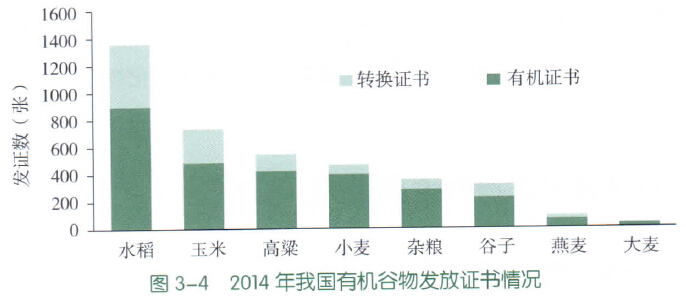 文章源自FOFCC-http://fofcc.org.cn/en/11577/
Cereal production area and yield make up the main components of total plant production area and yield. In 2014, the total cereal production area was 566,000 hectares, accounting for 50.5% of the total organic production area. Ranked by planting area, the top ten organic cereals are rice, wheat, maize, sorghum, miscellaneous grains, millet, oats, barley, mung beans and red beans. Rice has the largest production area at 182,000 hectares, accounting for 32.1% of the total. This is followed by wheat and maize at 122,000 hectares and 116,000 hectares respectively, accounting for 21.5% and 20.4% of the total certified cereal area. Together, these three crops account for 74.0% of the certified cereal area (Figure 3-5).
In terms of production, total cereal production stood at 3.197 million tonnes, accounting for 46% of total organic production, meaning that nearly half of all organically grown crops are cereals. Ranked by production volume, the top ten organic cereals are rice, maize, wheat, sorghum, oats, foxtail millet, barley, waxy maize, sweet corn, and buckwheat. Rice production remains the highest at 1.051 million tonnes, making up one-third of total cereal production. Maize and wheat account for 30.8% and 19.0% respectively, which corresponds to their percentage of production area, with the three main food crops together making up 82.7% of total cereal production (Figure 3-5).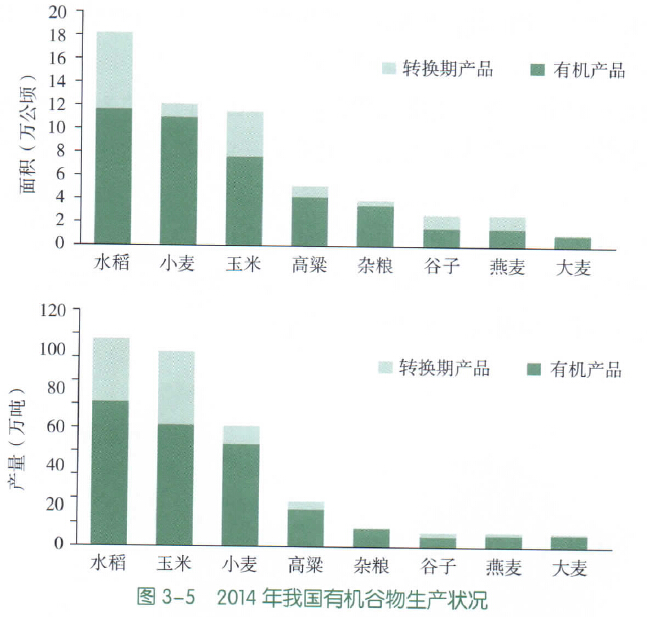 文章源自FOFCC-http://fofcc.org.cn/en/11577/
Looking at the proportion of organic and conversion products (after the new Administrative Measures for Organic Product Certification were implemented on 1 April 2014, conversion products could only be sold as conventional products; however, in this report, because the data covers the whole of 2014 and includes conversion products certified earlier, and to clearly identify products produced during the conversion period, the term conversion products is still used here, and the same applies to all following sections of this note), the conversion-period area for cereals accounts for 24.3% of the total organic cultivation area, and the output of conversion products accounts for 27.1% of the total organic product output. The proportions of conversion-period area for paddy rice and maize are 35.8% and 33.1% respectively, while the proportions of conversion-period area for barley, miscellaneous grains, and wheat are all less than 10%. The proportions of conversion-period output for paddy rice and maize are both greater than 30%, the proportion of conversion-period output for barley and miscellaneous grains is less than 6%, and the proportion of conversion-period output for other cereals is 15% to 30%.
3.4.1.2 Regional distribution
Organic grains produced in accordance with our country's organic product standards are distributed across 32 provinces, autonomous regions, and municipalities nationwide (Fig. 3-6), primarily in northern regions. For example, the top ten provinces and regions in terms of grain production area include Heilongjiang, Guizhou, Liaoning, Inner Mongolia, Jilin, Sichuan, Guangdong, Xinjiang, Hebei, and Shandong. The organic grain area in these top ten provinces accounts for 83.7% of the total area. This is largely related to the agricultural planting characteristics and climatic conditions of these provinces and municipalities. In addition, there is also a significant amount of organic grain crop cultivation in Guizhou, Jiangsu, and Sichuan, with areas ranking among the top ten.
Heilongjiang topped the list with 160,000 hectares, accounting for 28.3% of the total grain area; Guizhou Province ranked second with a production area of 97,000 hectares, while Liaoning with 11.4%, Inner Mongolia with 11.1%, and Jilin with 3.8% took the third to fifth places respectively. The total organic grain production area of these five provinces reached 71.6%. Analysing the output, Heilongjiang's grain production reached about 980,000 tonnes, accounting for 30.1% of the country's total organic grain production; combined with the organic grain output of the three provinces of Guizhou, Liaoning and Inner Mongolia, this accounted for 65.1% of the national total organic grain product output.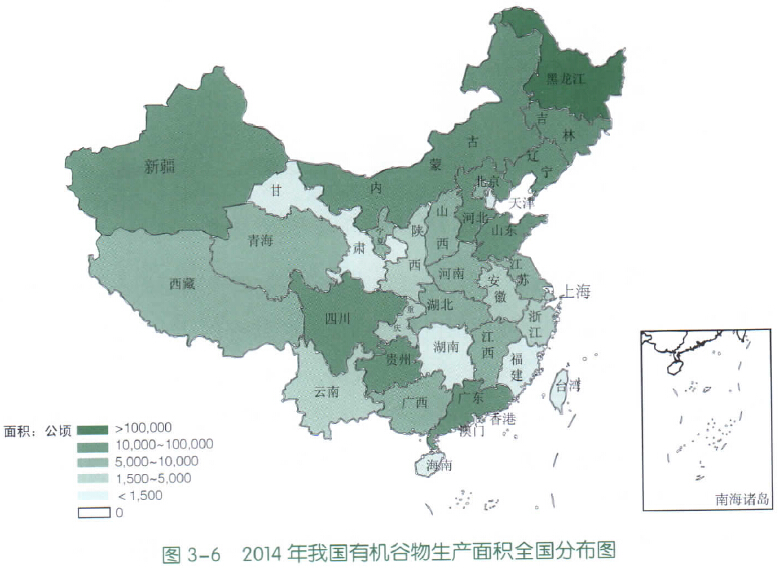 文章源自FOFCC-http://fofcc.org.cn/en/11577/
3.4.1.3 Development trends
Figure 3-7 shows the trend in the production area of organic grains in China from 2009 to 2014. As can be seen from the figure, the overall production area of organic grains showed an upward trend. Starting from 2011, the production area of organic grains for the past 4 years has basically remained at around 500,000 hectares. In 2014, the planting area of organic grains decreased somewhat, dropping by 3.4% compared with 2013. In 2014, grains with significant changes in area included wheat, the planting area of which decreased by 41,000 hectares, and millet,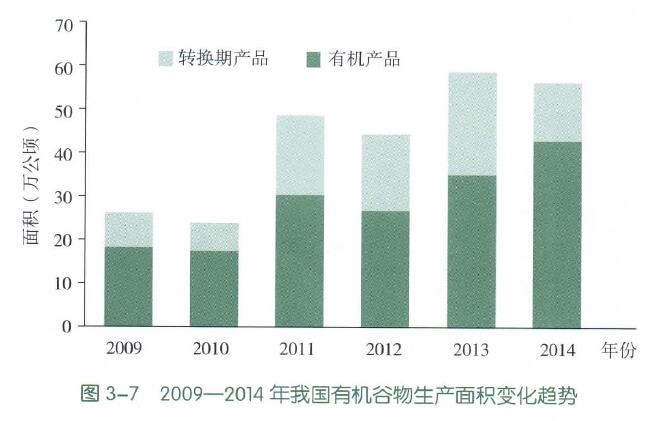 文章源自FOFCC-http://fofcc.org.cn/en/11577/
The areas of barley and mixed grains each decreased by 10,000 hectares; the planting areas of both maize and rice each increased by 10,000 hectares, and the areas of sorghum and oats each increased by 10,000 hectares.
3.4.2 Vegetable production
3.4.2.1 Overview of organic vegetable production
According to the Organic Product Directory, the organic vegetable directory includes 14 categories such as Chinese cabbage-type vegetables, root and tuber vegetables, and fresh aquatic vegetables. In this statistical count, edible fungi are not included among the organic vegetables.
In 2014, a total of 2,733 certificates were issued for organic vegetables, comprising 2,056 organic certificates and 677 conversion certificates. Categorised by the 14 types of vegetables, organic solanaceous vegetables received the most certificates at 431, accounting for 15.84% of the total organic vegetable certificates; this was followed by gourd vegetables with 344 certificates (12.6%), and root and tuber vegetables with 311 certificates (11.4%) (Figure 3-8).
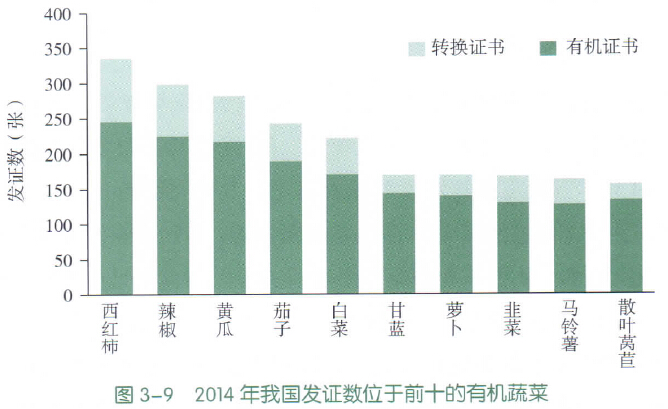
If we look at individual vegetable varieties, the organic vegetables with the top ten numbers of certificates issued in 2014 are shown in Figure 3-9. Of these ten vegetables, the first four all belong to fruit-bearing vegetables, there are also four kinds of leafy vegetables, and two root and lotus vegetables. Tomatoes received the most certificate, with 335 certificates and 323 certified enterprises; followed by peppers and cucumbers, with 298 and 282 certificates respectively, and 286 and 275 certified enterprises respectively. Ranked by area, the top ten organic vegetables are potatoes, bamboo shoots, sweet potatoes, peppers, cabbages, peas, lotus roots, broad beans, tomatoes and carrots; ranked by yield, the top ten organic vegetables are potatoes, cabbages, sweet potatoes, tomatoes, bamboo shoots, lotus roots, peppers, carrots, taros and yams. Whether ranked by number of certificates, area or yield, those consistently in the top ten are potatoes, peppers, cabbages and tomatoes; those in the top ten for both area and yield are bamboo shoots, sweet potatoes, lotus roots and carrots.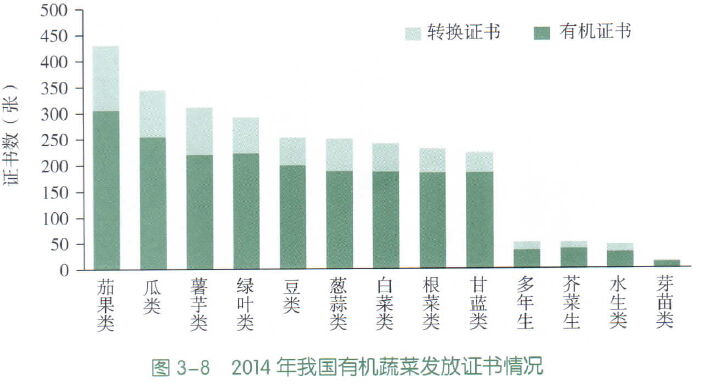 文章源自FOFCC-http://fofcc.org.cn/en/11577/
In terms of area statistics, the total organic vegetable production area in 2014 was 29,000 hectares, of which 21,000 hectares were organically grown vegetables and 8,000 hectares were vegetables under organic conversion. Root and tuber vegetables had the largest area at 9,800 hectares, accounting for 33.4 %; followed by perennial vegetables, legumes, and root vegetables. In the production process of sprout vegetables, since they basically do not require land and mostly use water or substrates for production, their land area occupied ranked last, at only 10 hectares (Figure 3-10).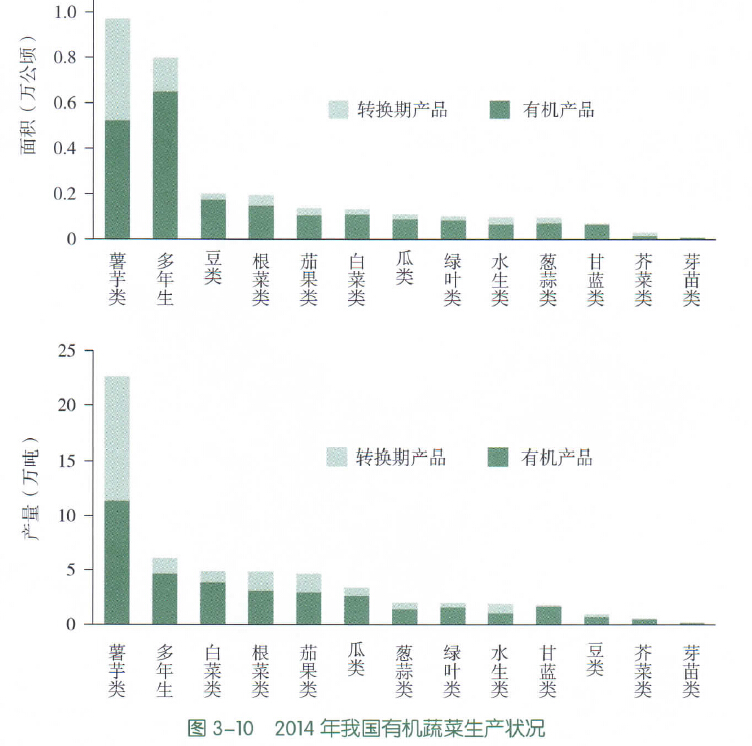 文章源自FOFCC-http://fofcc.org.cn/en/11577/
According to production statistics, the total output of organic and in-conversion certified vegetables in 2014 was 550,000 tonnes, of which organically certified output was 348,000 tonnes and in-conversion certified output was 202,000 tonnes. Root and tuber vegetables had the highest output at 226,000 tonnes, accounting for 41.1% of the total output, which may be largely related to the types and growth characteristics of root and tuber vegetables. Fresh perennial vegetables accounted for 10.9% of the total output, ranking second; the proportions of all other types were less than 10%.
In terms of the proportion of products in conversion, the area of vegetables in conversion accounted for 28.8% of the total organic vegetable cultivation area; the output of products in conversion accounted for 36.7% of the total organic product output. The proportion of mustard vegetables in conversion reached as high as 51.4%; cabbage and legumes were 6.8% and 11.3% respectively; the proportion of other vegetables in conversion was basically between 16% and 47%. The proportion of potato and yam vegetable products in conversion was 49.6%, and that of cole crops was 6.7%. The proportions for the remaining vegetable types ranged from 18% to 45%.
3.4.2.2 Regional distribution
The area of organic vegetables produced in accordance with our country's organic product standards is distributed across 30 provinces, autonomous regions, and municipalities directly under the Central Government (Figure 3-11). Unlike the distribution of organic grain area and yield, the distribution of organic vegetable production regions is relatively dispersed.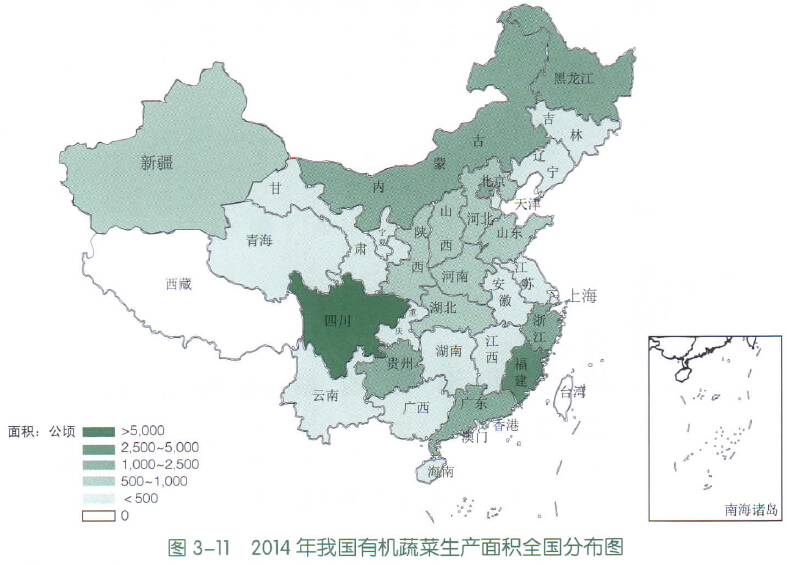 文章源自FOFCC-http://fofcc.org.cn/en/11577/
Analysing production area, Sichuan leads with 5,300 hectares of organic vegetable production area, accounting for 18.0 % of the total area; Fujian is second with 3,700 hectares, accounting for 12.4 %. Inner Mongolia, Beijing, Heilongjiang, Guizhou, Zhejiang and Guangdong each have over 1,000 hectares of organic vegetable production area, and together these provinces account for 66.4 %D of the total organic vegetable area. In terms of yield, Sichuan's organic vegetable production reached around 78,000 tonnes, accounting for 14.1 % of the total yield; Shandong's organic vegetable production was 59,000 tonnes, accounting for 10.8 % of the total yield.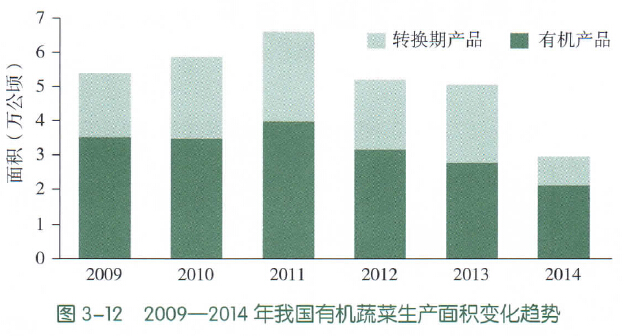 文章源自FOFCC-http://fofcc.org.cn/en/11577/
3.4.2.3 Development trends
Figure 3-12 shows the trend in the production area of organic vegetables in China from 2009 to 2014. The organic vegetable production area includes certified organic vegetable production area and in-conversion vegetable production area. From 2009 to 2014, the production area of organic vegetables in China first increased and then decreased, reaching its peak in 2011. From 2011 to 2013, although the production area of organic vegetables showed a downward trend, the magnitude of the decrease was not significant. Compared with 2013, the organic vegetable area in 2014 decreased by 41.8%, mainly because edible fungi were not included in the statistics for 2014, the area of perennial vegetables in 2014 decreased by 10,000 hectares, brassicas decreased by 4,000 hectares, and legumes, solanaceous fruits, leafy vegetables, and bulb vegetables all decreased by more than 1,000 hectares. The area that increased significantly was root and tuber vegetables, with an increase of 2,344 hectares.
3.4.3 Organic fruit
3.4.3.1 Overview of Organic Fruit Production
In 2014, the total number of organic fruit certificates issued was 1,894, comprising 1,002 organic certificates and 892 in the transition period. Categorised by organic fruit type, the top three categories in terms of certificates issued in 2014 were other fruits (571), grapes (283), and apples (170), as shown in Figure 3-13. Other fruits had the largest issuance proportion at 27.3% with 501 certified enterprises, followed by grapes accounting for 14.94% with 263 certified enterprises.
When looking at individual organic fruit products, the organic fruits and dried fruits with the top ten numbers of certificates issued in 2014 are shown in Figure 3-14. Among these ten fruits and nuts, only walnuts are nuts, while the remaining 9 are fruits. Table grapes received the most certificate, with 187 certificates and 183 certified enterprises; followed by apples and jujubes, with 169 and 156 certificates respectively, and 163 and 150 certified enterprises. Whether ranked by the number of certificates, area, or yield, the ones that consistently rank in the top ten are jujubes, apples, table grapes, pomelos, and walnuts; those ranking in the top ten for both area and yield are wine grapes.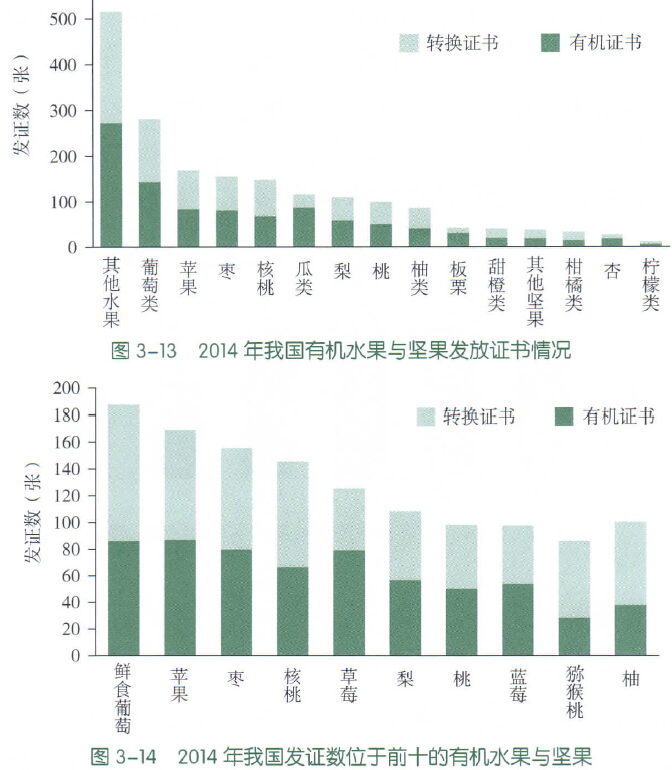 文章源自FOFCC-http://fofcc.org.cn/en/11577/
In 2014, the planting area of organic fruits and nuts was 136,000 hectares, accounting for 12.1% of the national organic crop planting area; the yield was 975,000 tonnes, accounting for 14.1% of the national certified organic crop yield. The proportions of the planting area and yield of organic fruits and nuts in conversion to the total organic fruits and nuts were 34.7% and 30.7% respectively.
The total area of organically certified fruit cultivation was 99,000 hectares. Sorted by area, the top ten organic fruits and nuts are jujubes, walnuts, hazelnuts, apples, wine grapes, chestnuts, table grapes, kiwifruit, blueberries, and pomelos. Among them, jujubes have the largest production area at 27,000 hectares, accounting for 20.2%; other fruit production areas cover 20,000 hectares, accounting for 14.9%. Ranking third to fifth are grapes, apples, and apricots. The proportion of conversion production area for most fruits ranges from 1/3 to 2/3. In terms of yield, organic fruit production reached 947,000 tonnes. Sorted by yield, the top ten organic fruits and nuts are jujubes, apples, pomelos, wine grapes, pears, oranges, table grapes, walnuts, watermelons, and melons. Among them, apples had the highest total production at 219,000 tonnes, accounting for 22.4% of fruit production; followed by jujubes at 170,000 tonnes, accounting for 17.4% of organic fruit production; and thirdly, pomelos at 107,000 tonnes. The proportion of products in the conversion period for fruits is generally high, with lemons reaching as high as 94.9% (Figure 3-15).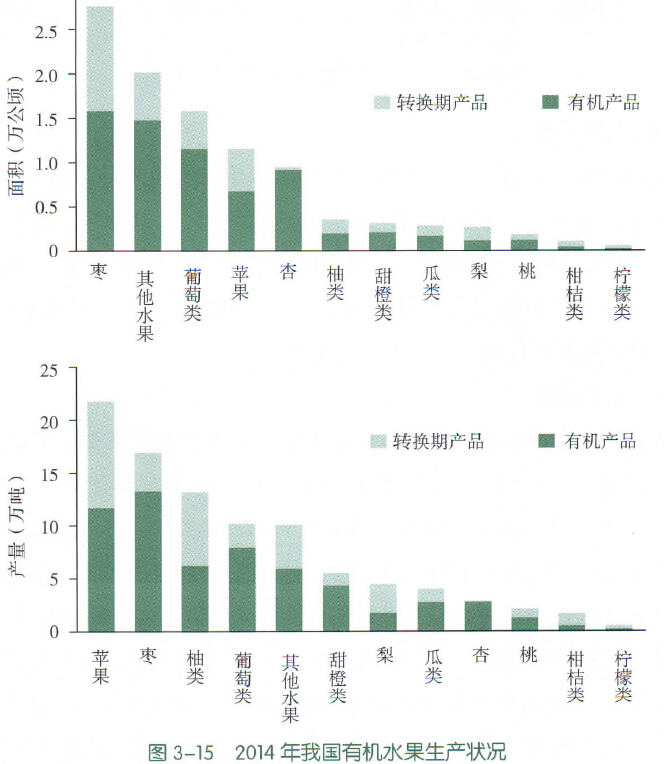 文章源自FOFCC-http://fofcc.org.cn/en/11577/
There are 36,000 hectares of organic nuts, accounting for approximately 26.8% of the total area under organic fruit and nut cultivation.,
Walnuts have the largest production area, at approximately 21,000 hectares. In terms of output, organic nuts total 62,000 tonnes, accounting for 6.4% of fruit and nut production, with walnuts having the highest yield at 34,000 tonnes (Figure 3-16). Other nuts account for 63.6% of the conversion period output, while walnuts and chestnuts each account for around 10%.
3.4.3.2 Regional distribution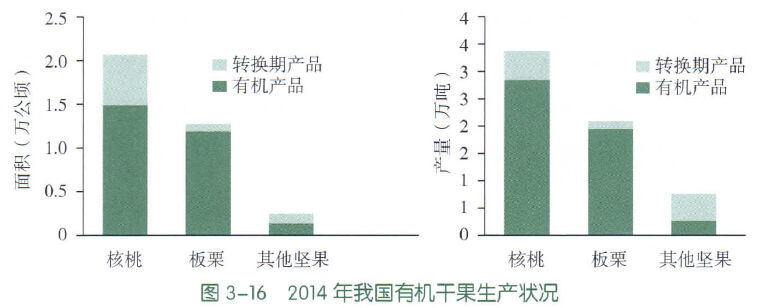 文章源自FOFCC-http://fofcc.org.cn/en/11577/
Except for Tibet and Qinghai, all other provinces and autonomous regions in China produce organic fruit (Fig. 3-17). Analysing the production area, Xinjiang leads the country with 36,000 hectares of organic fruit production area, accounting for 26.7% of the total area; Shaanxi is second with 14,000 hectares, accounting for 10.8%. Analysing the output, Xinjiang's organic fruit production reached about 260,000 tonnes, accounting for 26.6% of the total output, while Shaanxi's organic fruit production was 158,000 tonnes, accounting for 16.2% of the total output.
3.4.3.3 Development trends
The production area for organic fruit includes both certified organic fruit production area and conversion certified fruit production area, with the proportion of fruit area in the conversion period basically remaining within the range of 30% to 45% each year. Figure 3-18 shows the production area of organic fruit certified according to Chinese standards from 2009 to 2014. From 2009 to 2014, the trend in China's organic fruit production area was unstable, reaching a peak in 2011. A new organic standard was implemented starting in 2012, which was stricter and led to a decline in the organic fruit production area that year. Compared with 2012, the total organic fruit production area increased by 9.9% in 2013. In 2014, the planting area for organic fruit and nuts decreased by 85,000 hectares compared to 2013, mainly due to significant reductions in the areas for jujubes, other fruits, walnuts, and other nuts, with these four types of fruit accounting for a combined reduction of 65,000 hectares.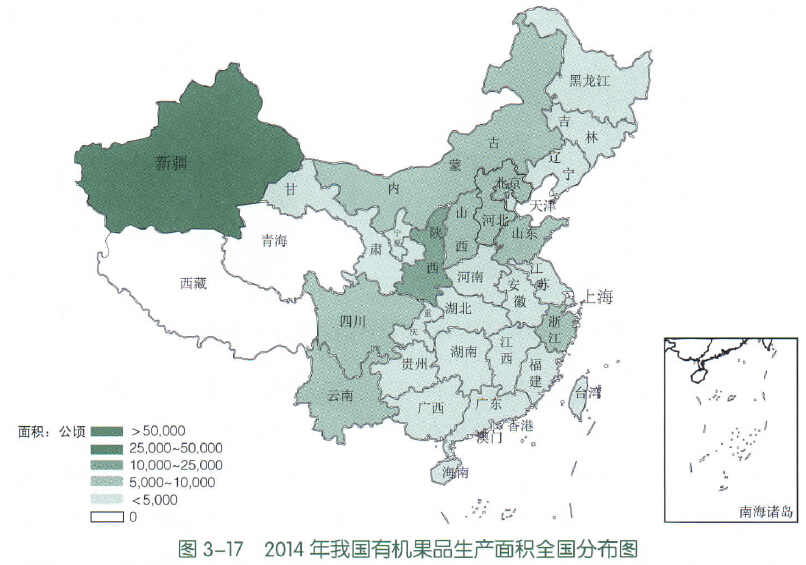 文章源自FOFCC-http://fofcc.org.cn/en/11577/
3.4.4 Oilseed crops
3.4.4.1 Production overview
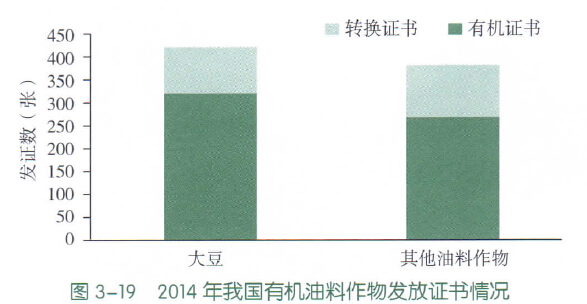
Oil crops include soybeans and other oil crops. According to 2014 statistics, the number of soybean certificates issued was 420, of which organic certificates and conversion period certificates numbered 319 and 101 respectively, and the number of certified enterprises was 326; the total number of certificates for other oil crops was 380, of which organic certificates and conversion
The numbers of period certificates were 267 and 113 respectively, and the number of certified enterprises was 346 (Figure 3-19).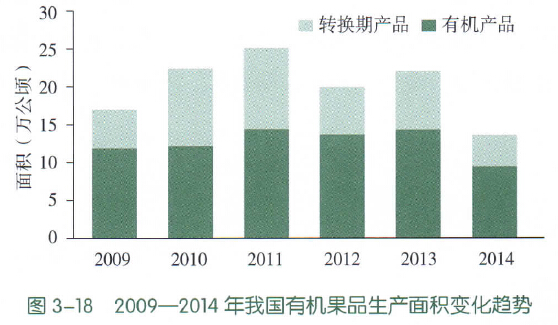 文章源自FOFCC-http://fofcc.org.cn/en/11577/
The top ten organic oilseed crops by number of certificates issued in 2014 are shown in Figure 3-20. Soybeans received the most at certificate, with 415 certificates and 323 certified enterprises; this was followed by peanuts and tea seeds, with 130 and 89 certificates, and 124 and 87 certified enterprises, respectively. Ranked by area, the top ten organic oilseed crops are soybeans, tea seeds, sunflower seeds, oil tea seeds, peanuts, rapeseed, safflower seeds, flaxseed, sesame, and hemp seeds; when ranked by yield, the top ten organic oilseed crops are soybeans, tea seeds, sunflower seeds, peanuts, rapeseed, oil tea seeds, flaxseed, safflower seeds, sesame, and pumpkin seeds. Regardless of whether they are ranked by the number of certificates, area, or yield, the ones that consistently rank in the top ten are soybeans, peanuts, tea seeds, sunflower seeds, flaxseed, sesame, rapeseed, and safflower seeds.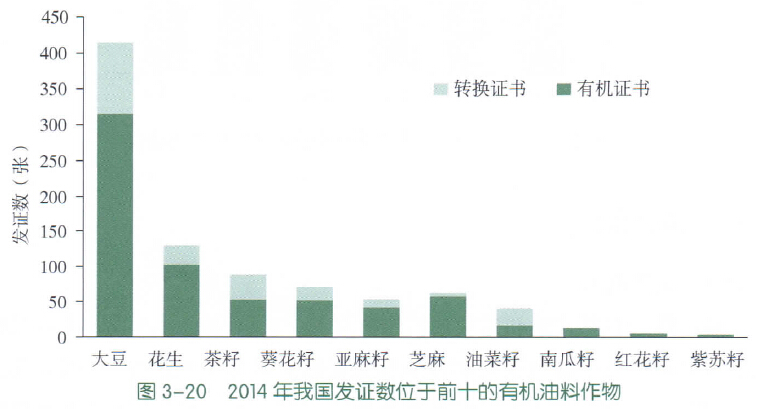 文章源自FOFCC-http://fofcc.org.cn/en/11577/
In 2014, the total certified area of organic oilseed crops in China was 231,000 hectares, with a total production of 516,000 tonnes. The production area of soybeans was 101,000 hectares, accounting for 43.8% of all oilseed crop production, while the production area of other oilseed crops was 130,000 hectares, accounting for 56.2%. The total production of organic soybeans was 313,000 tonnes, accounting for 60.6%, and the production of other oilseed crops was 203,000 tonnes, accounting for 39.4% (Figure 3-21).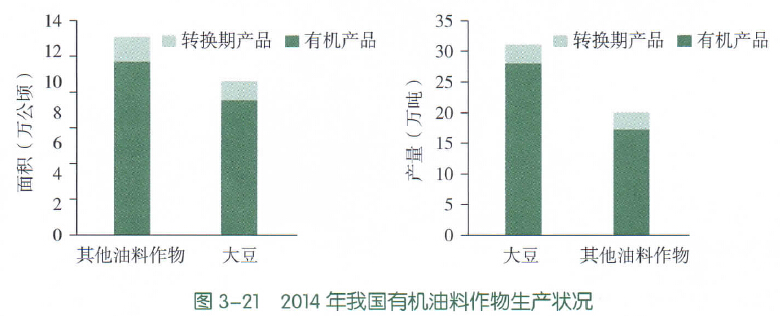 文章源自FOFCC-http://fofcc.org.cn/en/11577/
3.4.2 Regional distribution
Organic oil crops produced in accordance with China's organic product standards are distributed across 29 provinces and municipalities (Figure 3-22). Analysing production area, Heilongjiang province has an organic oil crop production area of 49,000 hectares, accounting for 21.4% of the total area, while Liaoning ranks second with an area of 34,000 hectares, accounting for 14.7%. The oil crops in Heilongjiang and Liaoning are mainly soybeans. Ranking third is Jiangxi province, where the organic oil crops are mainly tea oil seeds. In addition, the organic oil production areas in Hunan, Inner Mongolia, Hebei and Anhui provinces also range between 10,000 and 30,000 hectares. Analysing production volume, Heilongjiang province's organic oil crop production reached around 131,000 tonnes, accounting for 25.4% of the total output; Liaoning province's organic oil crop production was 103,000 tonnes, accounting for 19.9% of the total output and ranking second.
3.4.4.3 Development trends
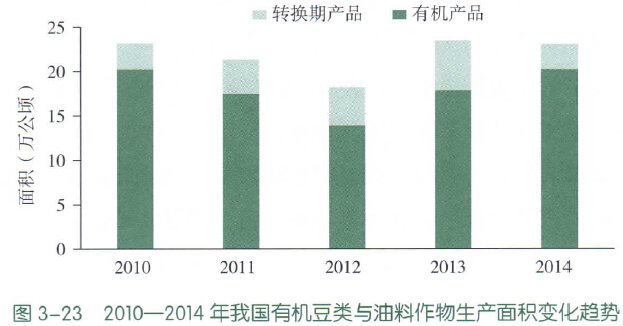
Between 2010 and 2014, the production areas for soybeans and other oil crops showed a gradual upward trend, though with little significant growth. The organic production area for soybeans and other oil crops largely remained at around 200,000 hectares. In 2014, the total certified area of organic oil crops in China was 231,000 hectares, with the planting area in the organic conversion period accounting for approximately 12% to 24% of the total planting area of organic oil crops (Figure 3-23).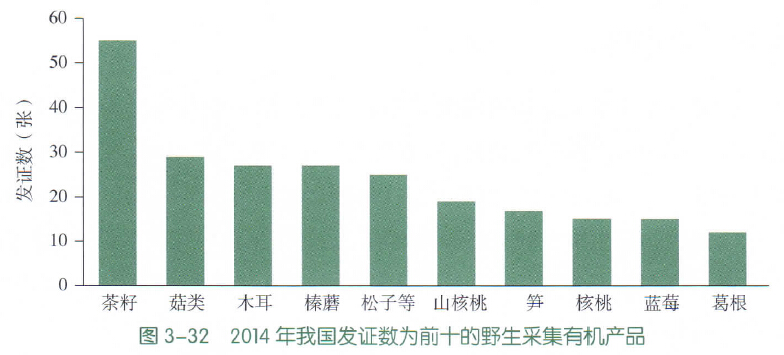 文章源自FOFCC-http://fofcc.org.cn/en/11577/
3.4.5 Tea production
3.4.5.1 Production Overview
China is a major tea-growing and consuming country. According to data analysis by the National Bureau of Statistics, in 2013 China had a total tea garden area of 2.469 million hectares, a harvested tea garden area of 1.857 million hectares, and a production volume of approximately 1.925 million tonnes, which increased to 2.096 million tonnes in 2014. Regarding the production status of organic tea, a total of 927 organic tea certification certificates were issued in 2014, including 592 organic certificates and 335 conversion-period certificates. In 2014, the organically certified tea production area was 46,000 hectares, with a yield of 88,000 tonnes. The tea area in the conversion period was 13,000 hectares, accounting for 28.6%, and the production volume accounted for 29.8% (Figure 3-24). The organic tea production area accounted for 1.9% of the national conventional tea production area, and the output accounted for 4.2%.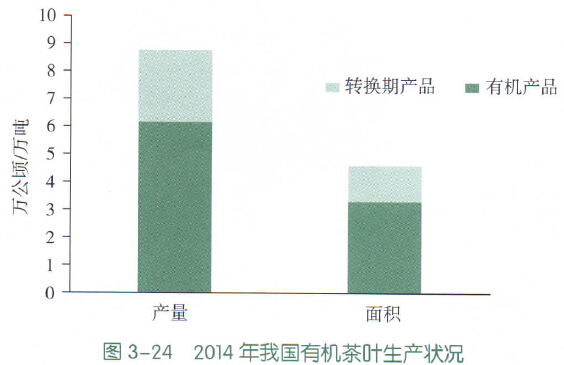 文章源自FOFCC-http://fofcc.org.cn/en/11577/
3.4.5.2 Regional distribution
In terms of regional distribution (Figure 3-25), organic tea is produced in 19 provinces, autonomous regions and municipalities in China, which are basically distributed in the regions south of the Qinling Mountains-Huaihe River line that are suitable for tea cultivation. Yunnan Province ranks first, with an organic tea production area of 10,000 hectares. The organic tea production areas in the five provinces of Sichuan, Guizhou, Guangxi, Zhejiang and湖北 range between 2,500 and 5,000 hectares. In addition, the production areas of Anhui, Fujian, Jiangsu, Jiangxi, Shaanxi, Hunan, Guangdong, Henan and Shandong range from 1,000 to 2,500 hectares, while the production areas of the other 4 provinces and municipalities are less than 1,000 hectares. In Taiwan, the area certified for Chinese standard organic tea is 16 hectares.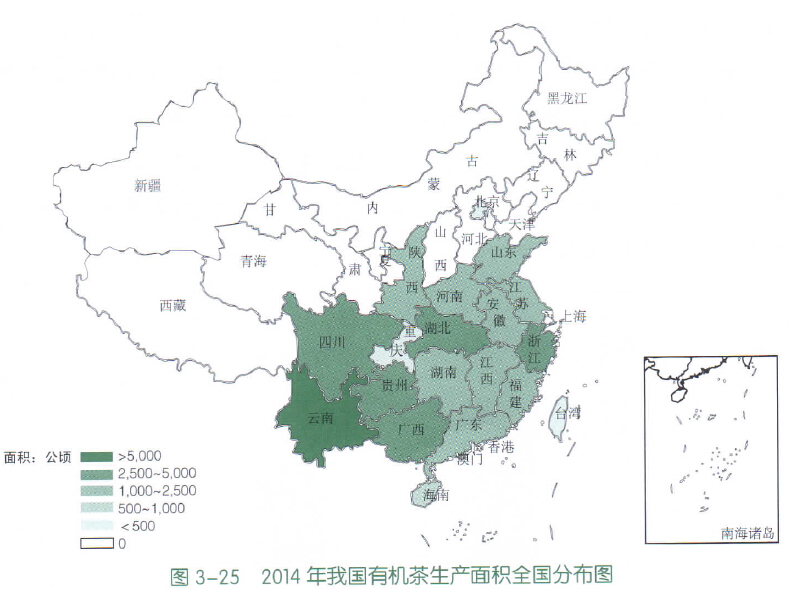
3.4.5.3 Development trends
In the early stages of organic tea production, according to incomplete statistics, the production area of organic tea was less than 700 hectares, which is about 10,000 mu, and the organic tea produced during this period was mainly for export. As can be seen from Figure 3-26, starting from 2006, China's organic tea production area stood at 20,000 hectares and has since continued to grow every year, reaching 50,000 hectares by 2011, which was 2.5 times the organic tea production area in 2006. From 2011 to 2014, the organic tea production area remained above 40,000 hectares.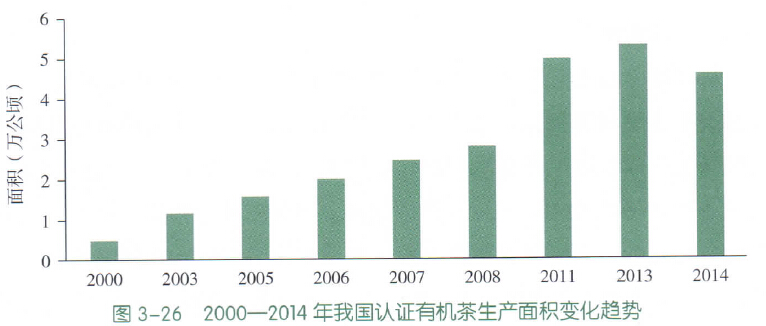 文章源自FOFCC-http://fofcc.org.cn/en/11577/
3.4.6 Organic production status of other organic crops
3.4.6.1 Production overview
Apart from grains, vegetables, fruits and nuts, legumes and oilseeds, and tea, other common plants are classified as other plants. The products involved include silage, botanical traditional Chinese medicines, and textile plant raw materials. Due to the relatively large production area of silage, it is analysed separately in this report.
In 2014, the total number of issued silage certificates was 105, comprising 56 organic certificates and 49 in-conversion certificates, with 81 certified enterprises. In 2014, the total production area of organic silage in our country was 85,000 hectares, of which 74,000 hectares was organic production area, accounting for 87.0% of the total area. The total output was 1.377 million tonnes (Figure 3-27). The production of organic silage is mainly distributed in the north-east and north-west regions of China, which aligns with the regional distribution of livestock farming in our country. In 2014, a total of 20 provinces, municipalities and autonomous regions in China produced organic silage. Among them, Inner Mongolia had an organic silage production area of 58,000 hectares, accounting for 67.4% of the total production area; Xinjiang ranked second with 13,000 hectares, accounting for 15.5% of the total production area; and Heilongjiang ranked third.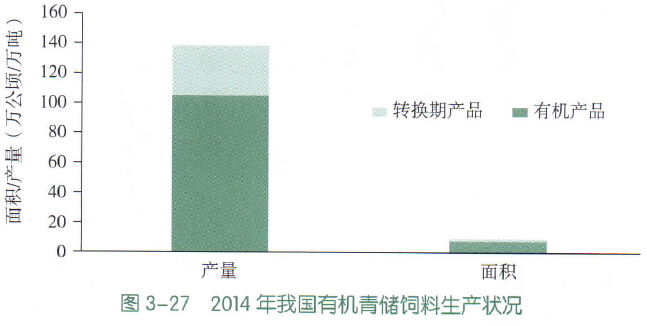
In 2014, other organic crops in China involved seven categories of products, including traditional plant-based Chinese medicines, flowers, spice crops, plant raw materials for textiles, sugar-making plants, seeds and propagation materials, and aromatic plants (Figure 3-28). In 2014, the total number of certificates issued for other crops was 442, among which there were 244 organic certificates, 198 in-conversion certificates, and 421 certified enterprises. Plant-based Chinese medicines had the highest number of certificates issued at 291, with 279 certified enterprises; aromatic plants had the lowest number of certificates issued at 7, with 7 certified enterprises.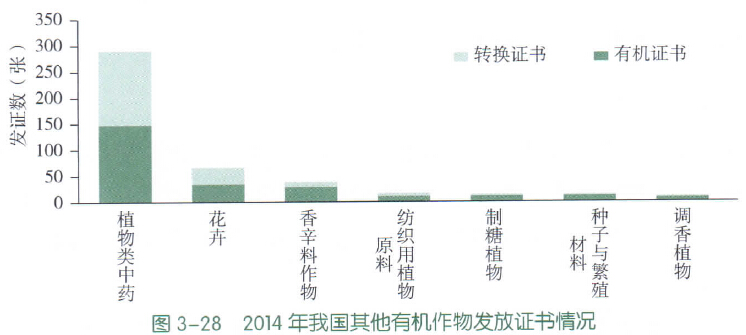 文章源自FOFCC-http://fofcc.org.cn/en/11577/
3.4.6.2 Regional distribution
In terms of regional distribution (Figure 3-30), other crops have the largest production area in Zhejiang at 6,816 hectares, with Xinjiang ranking second at 4,877 hectares, and Inner Mongolia at 3,766 hectares. In addition, the production areas in Yunnan, Heilongjiang, Sichuan, Henan, Shaanxi, and Jilin range between 1,000 and 2,500 hectares. Zhejiang focuses mainly on flower production, Xinjiang primarily on plant materials for textiles and spice crops, and Inner Mongolia mainly on plant materials for textiles.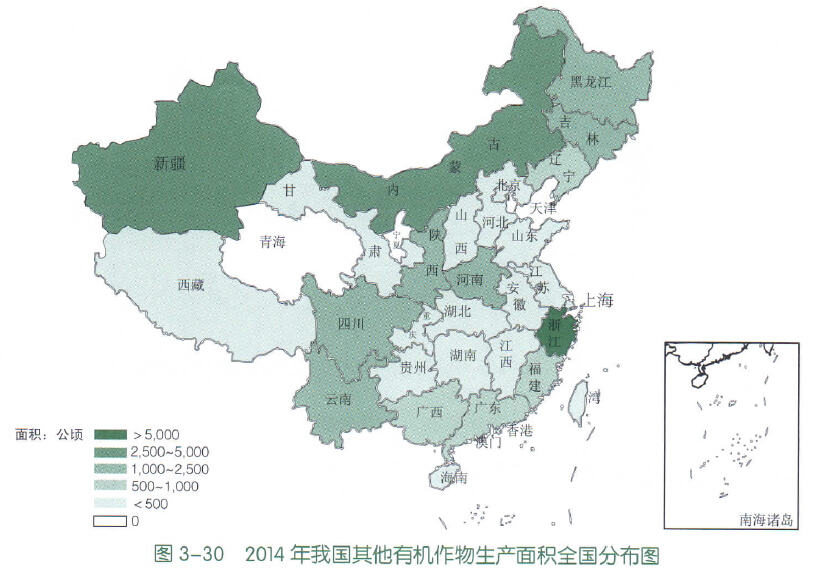 文章源自FOFCC-http://fofcc.org.cn/en/11577/
3.4.6.3 Development trends
Compared with 2013, both the area and output of other crops increased in 2014. The area in 2014 was 1.4 times that of 2013, and the output was 1.3 times. Flowers saw the largest increase in area, rising by 290.1%, while textile plant materials, medicinal plants and sugar crops increased by 30.2%, 20.7% and 18.6% respectively; the areas for perfume plants, seeds and propagation materials, and spices decreased. The output of spices ranked first in terms of growth rate, with the output in 2014 being 5.0 times that of 2013, followed by sugar crops at 1.4 times; the output of medicinal plants, perfume plants, seeds and propagation materials, textile plant materials and flowers decreased (Figure 3-31).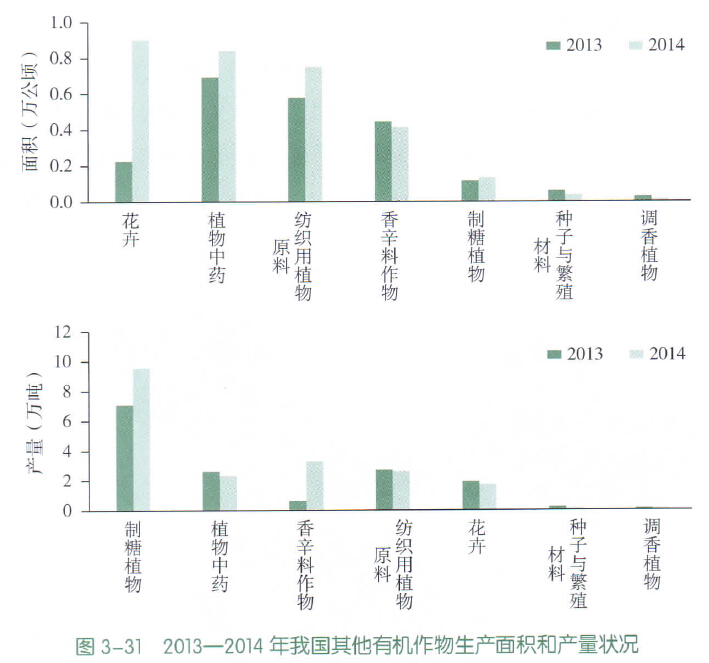 文章源自FOFCC-http://fofcc.org.cn/en/11577/
3.5 Production status of wild-collected organic products
3.5.1 Production Overview
In 2014, the area of wild-collected organic products in China was 822,000 hectares, with a total output of 620,000 tonnes. Wild-collected products included wild edible fungi, nuts, fruits, wild vegetables, and traditional Chinese herbal medicines. Figure 3-32 shows the top ten wild-collected organic products in China by the number of certificates issued in 2014. Among the ten products, there are three types of edible fungi, three types of nuts, one type each of fruit, vegetable, and traditional Chinese herbal medicine, and one type of oilseed. Tea seed had the highest number of certificates at 55, followed by mushrooms (29), black fungus (27), honey fungus (27), and pine nuts (25), with the respective numbers of certified enterprises being 53, 27, 25, 27, and 25. Hickory nuts, bamboo shoots, walnuts, blueberries, and kudzuvine root each had between 10 and 20 certificates, with 10 to 20 certified enterprises.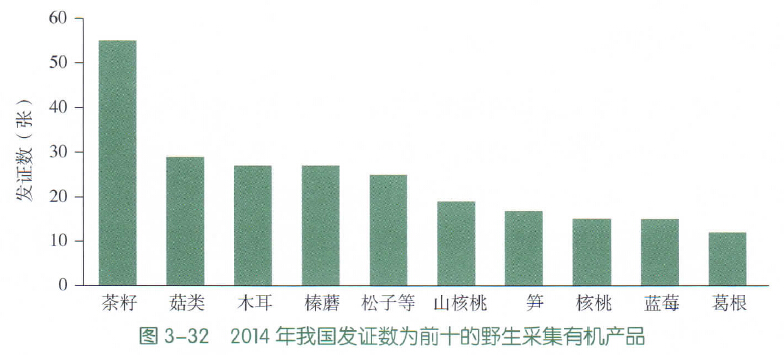 文章源自FOFCC-http://fofcc.org.cn/en/11577/
3.5.2 Regional distribution
The regional area distribution of wild-harvested organic products in China in 2014 is shown in Figure 3-33. As can be seen from the figure, the main regions for wild-harvested organic products in China are the north-east and north-west regions. The top five regions are Heilongjiang (281,000 hectares), Jilin (84,000 hectares), Qinghai (67,000 hectares), Inner Mongolia (61,000 hectares), and Zhejiang (28,000 hectares), whereas the wild-harvested area in the coastal eastern region is very small.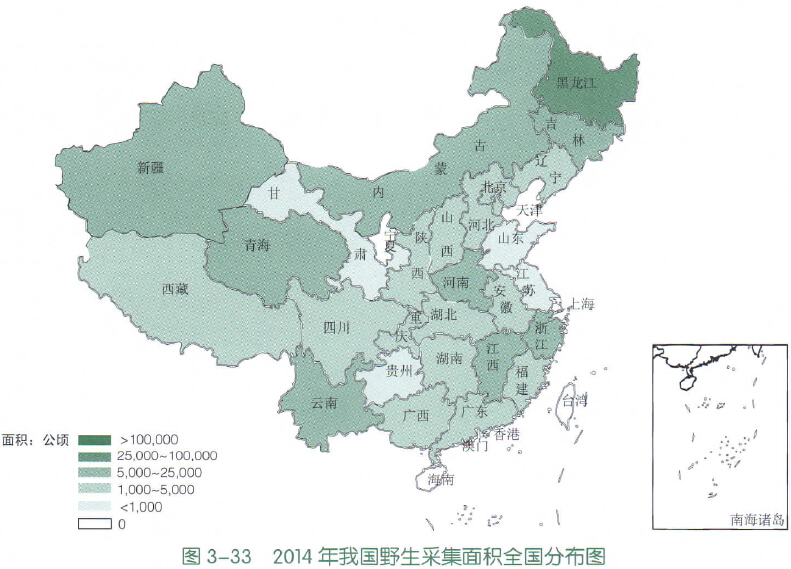 文章源自FOFCC-http://fofcc.org.cn/en/11577/
3.5.3 Development trends
The trends in the area and yield of wild-harvested organic products over the ten-year period from 2005 to 2014 are shown in Figure 3-34. From 2011 onwards, the wild-harvested area showed a downward trend, with the wild-harvested area in 2014 decreasing by 43.1% compared to 2013, although the yield from wild harvesting in 2014 increased by 3.3% compared to 2013. This was due to an increase in the harvesting area for wild fruits. Among wild harvesting, the harvesting area for wild fruits was the largest at 431,000 hectares, accounting for 52.4% of the total area; the yield of wild fruits was 409,000 tonnes, accounting for 66.0% of the total yield. However, in 2013, the area of wild fruits accounted for 18.2% of the total area, and the yield accounted for 52.6% of the total yield.
文章源自FOFCC-http://fofcc.org.cn/en/11577/